
Help & User Guide
How to get the most out of every part of Track My Wealth.
This guide walks through each part of the site, with screenshots and tips on setting things up so your numbers — and especially your net worth graph — stay accurate over time. The screens use sample data for a fictional family. If you're new here, start with Getting started; if you're after something specific, jump straight to it below.
Getting started
A wealth file is one household or entity's complete picture — properties, shares, cash, loans and everything else. Log in at trackmywealth.au with your email and password; if you have turned on two-factor authentication you will also be asked for the 6-digit code from your authenticator app. New to Track My Wealth? Choose Sign up and pick your Country along with your name, email and password — it sets your currency and which tax tools you see (see Account & security).
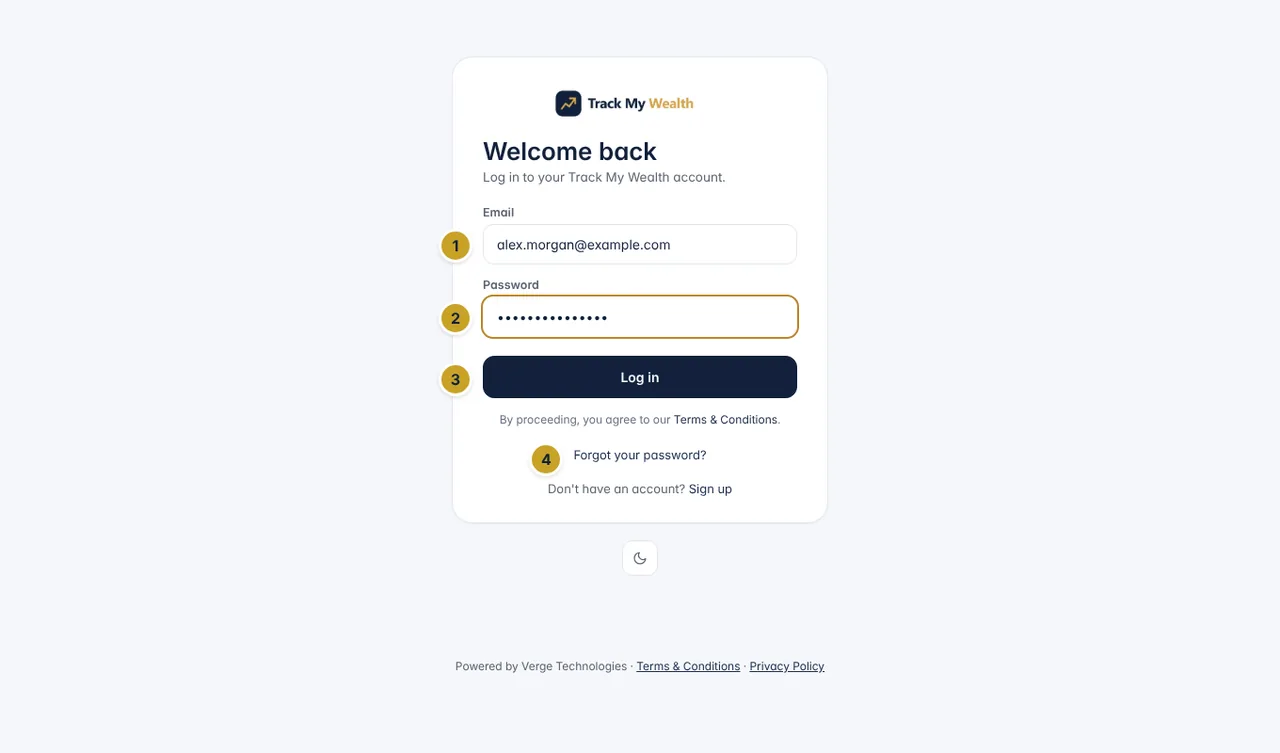
- Password
- Log in button
- Forgot your password?
After you log in, My wealth files lists every wealth file you own or have access to. A small badge shows your role on each one — Owner, Manager, Editor or Viewer. Click Open to go in; Rename, Share and Delete manage the file; + New wealth file starts another. The free Starter plan includes one wealth file of your own (files other people share with you don't count); Advanced and Client Manager have no limit.
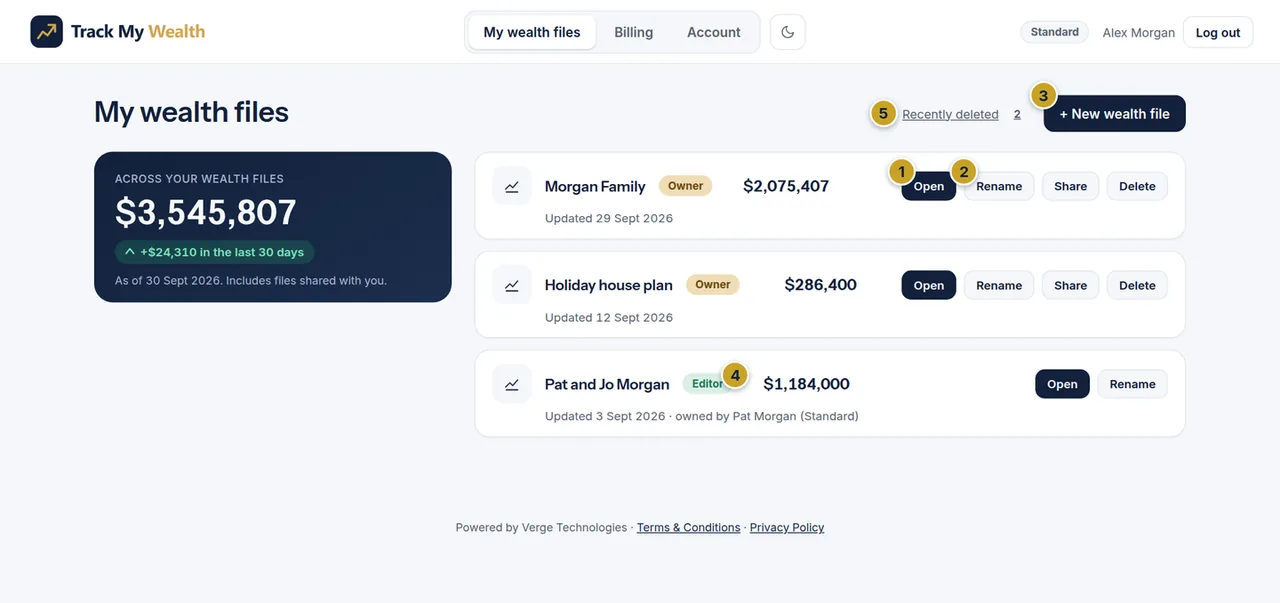
- Open
- Rename, Share and Delete
- New wealth file
- Role badge on a shared file
- Recently deleted
Multiple people, one wealth file
Use the profile switcher near the top of the page to add a second profile — typically a partner — within the same wealth file. Each profile has its own properties, shares, cash and so on, and a Household total combines them automatically. This is different from sharing a wealth file with another person's login (see Sharing & multiple profiles below) — profiles are for combining two people's own holdings into one household view.
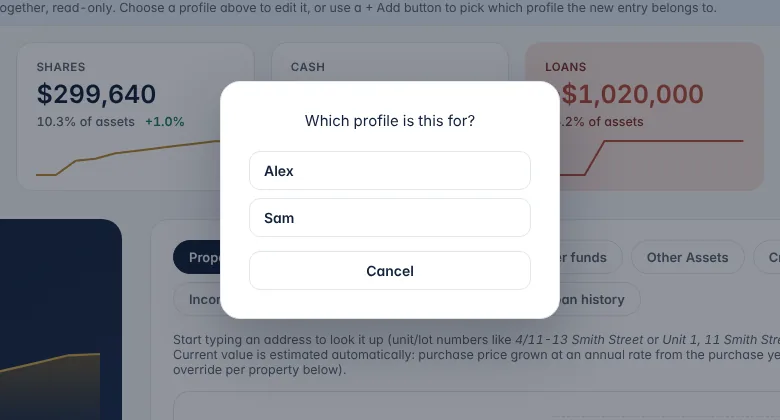
With two or more profiles, the switcher also has a Combined (all profiles) choice. It adds every profile together — net worth, cash flow, the charts and the projection — and tags each entry with the profile it belongs to. Combined is read-only: choose a profile to edit it, or use a + Add button and pick which profile the new entry is for. The FIRE countdown, age benchmark and land tax cards are hidden there, because they describe one person.
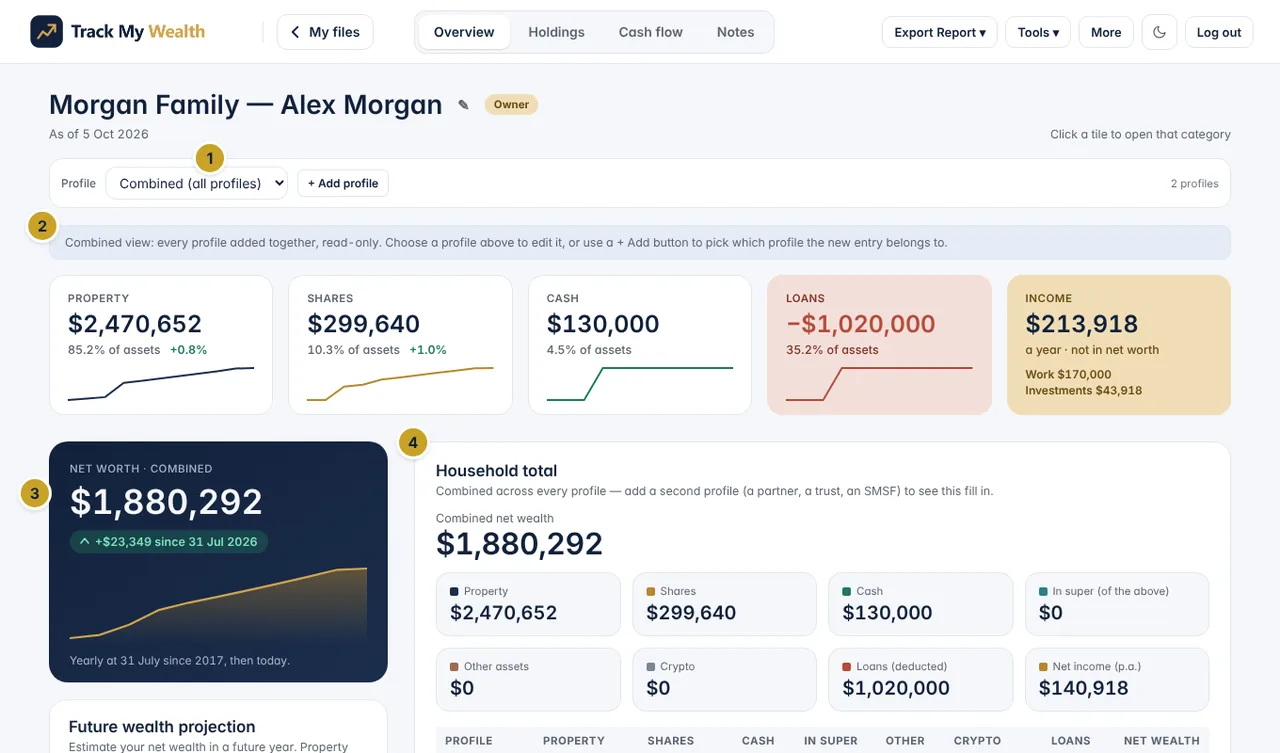
- Profile switcher set to Combined (all profiles)
- Read-only banner
- Net worth across every profile
- Household total
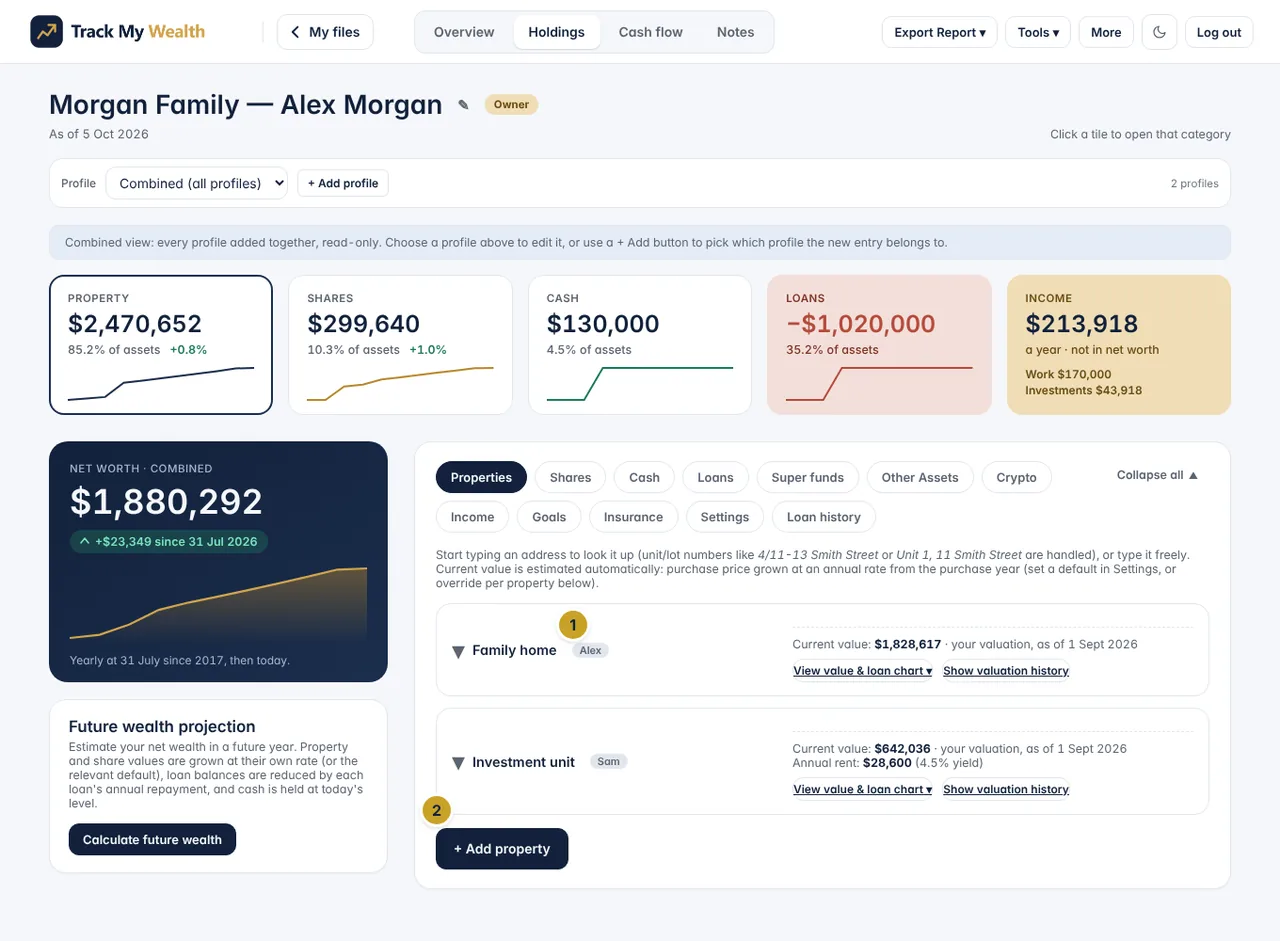
- Profile tag on each entry
- + Add (asks which profile the entry is for)
Finding your way around a wealth file
The wealth file page has been redesigned. A switcher at the top moves between four views, and everything else sits under the headings below.
- Overview — the file name and your role, your net worth, a tile for each category (click a tile to jump straight to that category), the household total, the FIRE countdown and the charts.
- Holdings — where you add and edit everything. A row of category tabs runs across the top: Properties, Shares, Cash, Loans, Super funds, Other Assets, Crypto, then Income, Goals, Insurance, Settings and Loan history.
- Cash flow — income and costs, and the five-year projection.
- Notes — the file's shared, timestamped journal.
In the top bar you'll also find the save status (for example "Saved just now"), Export Report, the Tools menu, a More menu (Help, plus Export backup and Import backup, which save or restore a JSON copy of the file), a light/dark toggle and Log out. The ← My files button takes you back to your list.
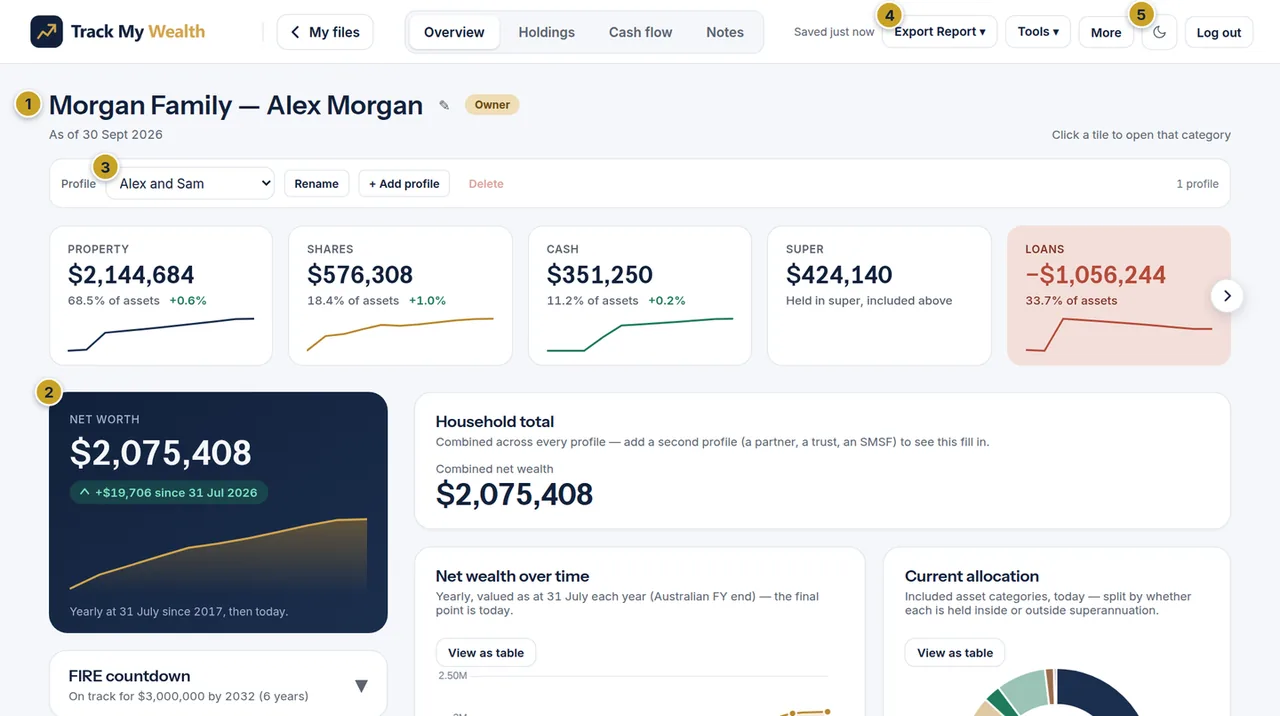
- File name and role badge
- Net worth summary
- Profile switcher
- Export Report
- Theme toggle
Your net worth graph & charts
The three charts on the Overview are the payoff for filling in the tabs accurately — they're only ever as good as the data behind them.
- Net wealth over time — one point per financial year (valued as at 31 July), ending at today. Click "View as table" to see the exact figures behind the line.
- Asset breakdown over time — the same timeline, split by property/shares/cash/other assets/crypto, with loans shown as a deduction.
- Current allocation — today's split across categories, further split by whether each holding is inside or outside superannuation.
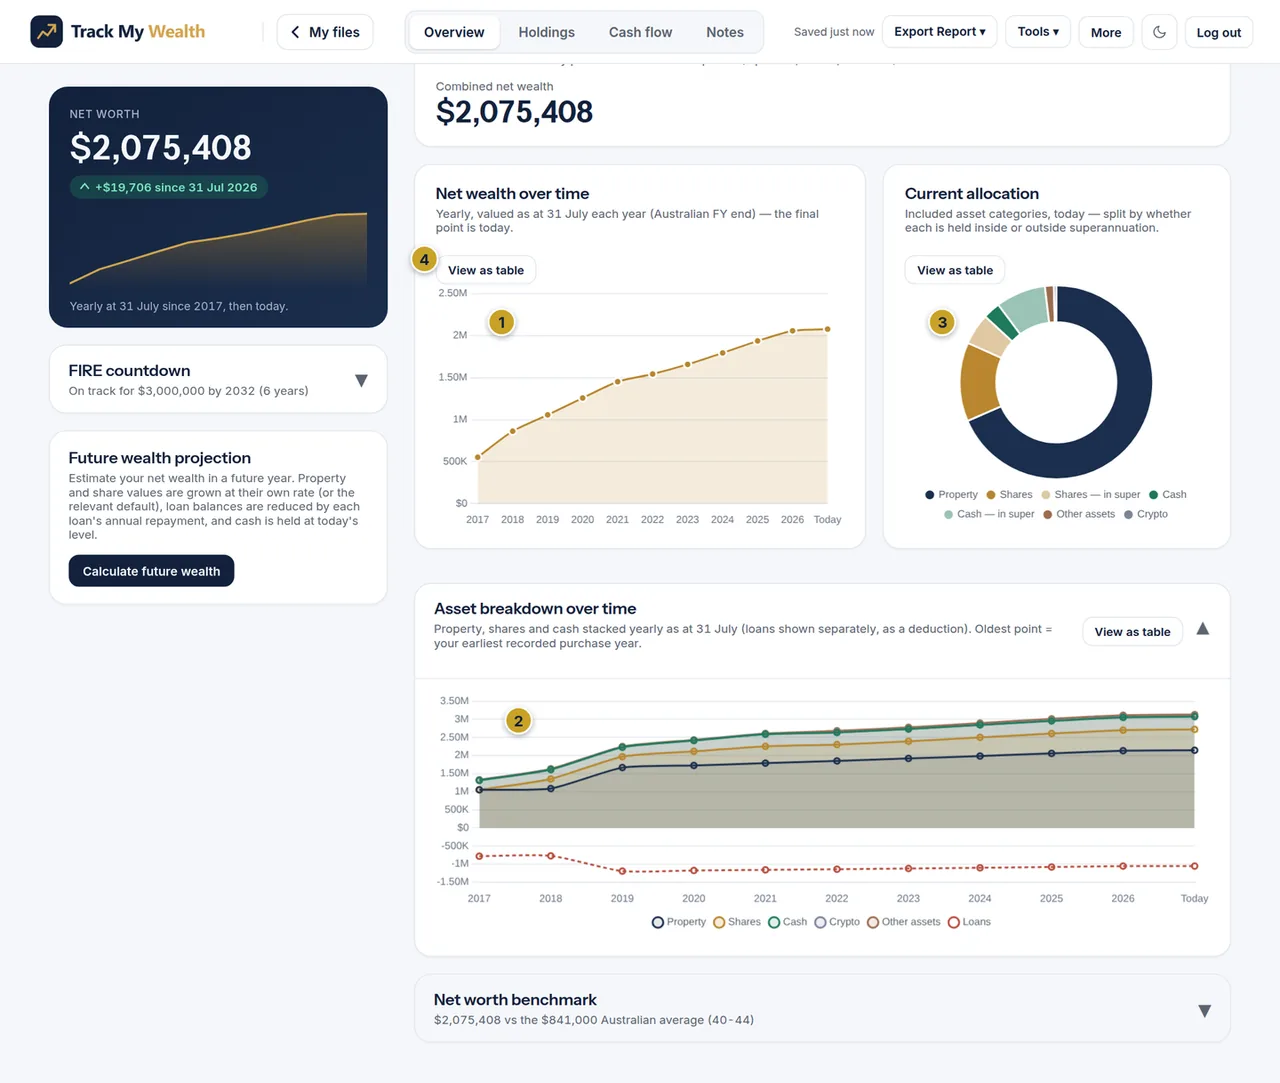
- Net wealth over time chart
- Asset breakdown over time chart
- Current allocation chart
- View as table
The graph's starting year is set automatically from your oldest recorded property purchase year, share/crypto acquisition date, cash account start year or other-asset start year — whichever is earliest. Every year before that simply isn't drawn.
Editing safely: Save, Cancel, Undo
Holdings now have an explicit edit mode, so nothing changes until you say so.
- Edit, then Save or Cancel. Click an entry to expand it, then Edit. Your changes are only stored when you press Save; Cancel walks away with nothing changed.
- One edit at a time. While you're editing, the category's + Add button is greyed out, so you can't lose a half-finished edit by starting another.
- Undo. When you remove an entry, a message appears at the bottom of the screen for a few seconds with an Undo button. Press it straight away to bring the entry back.
- Recently deleted. A whole wealth file you delete isn't gone immediately: it moves to Recently deleted on My wealth files, where you can Restore it for 30 days. After that it's erased for good.
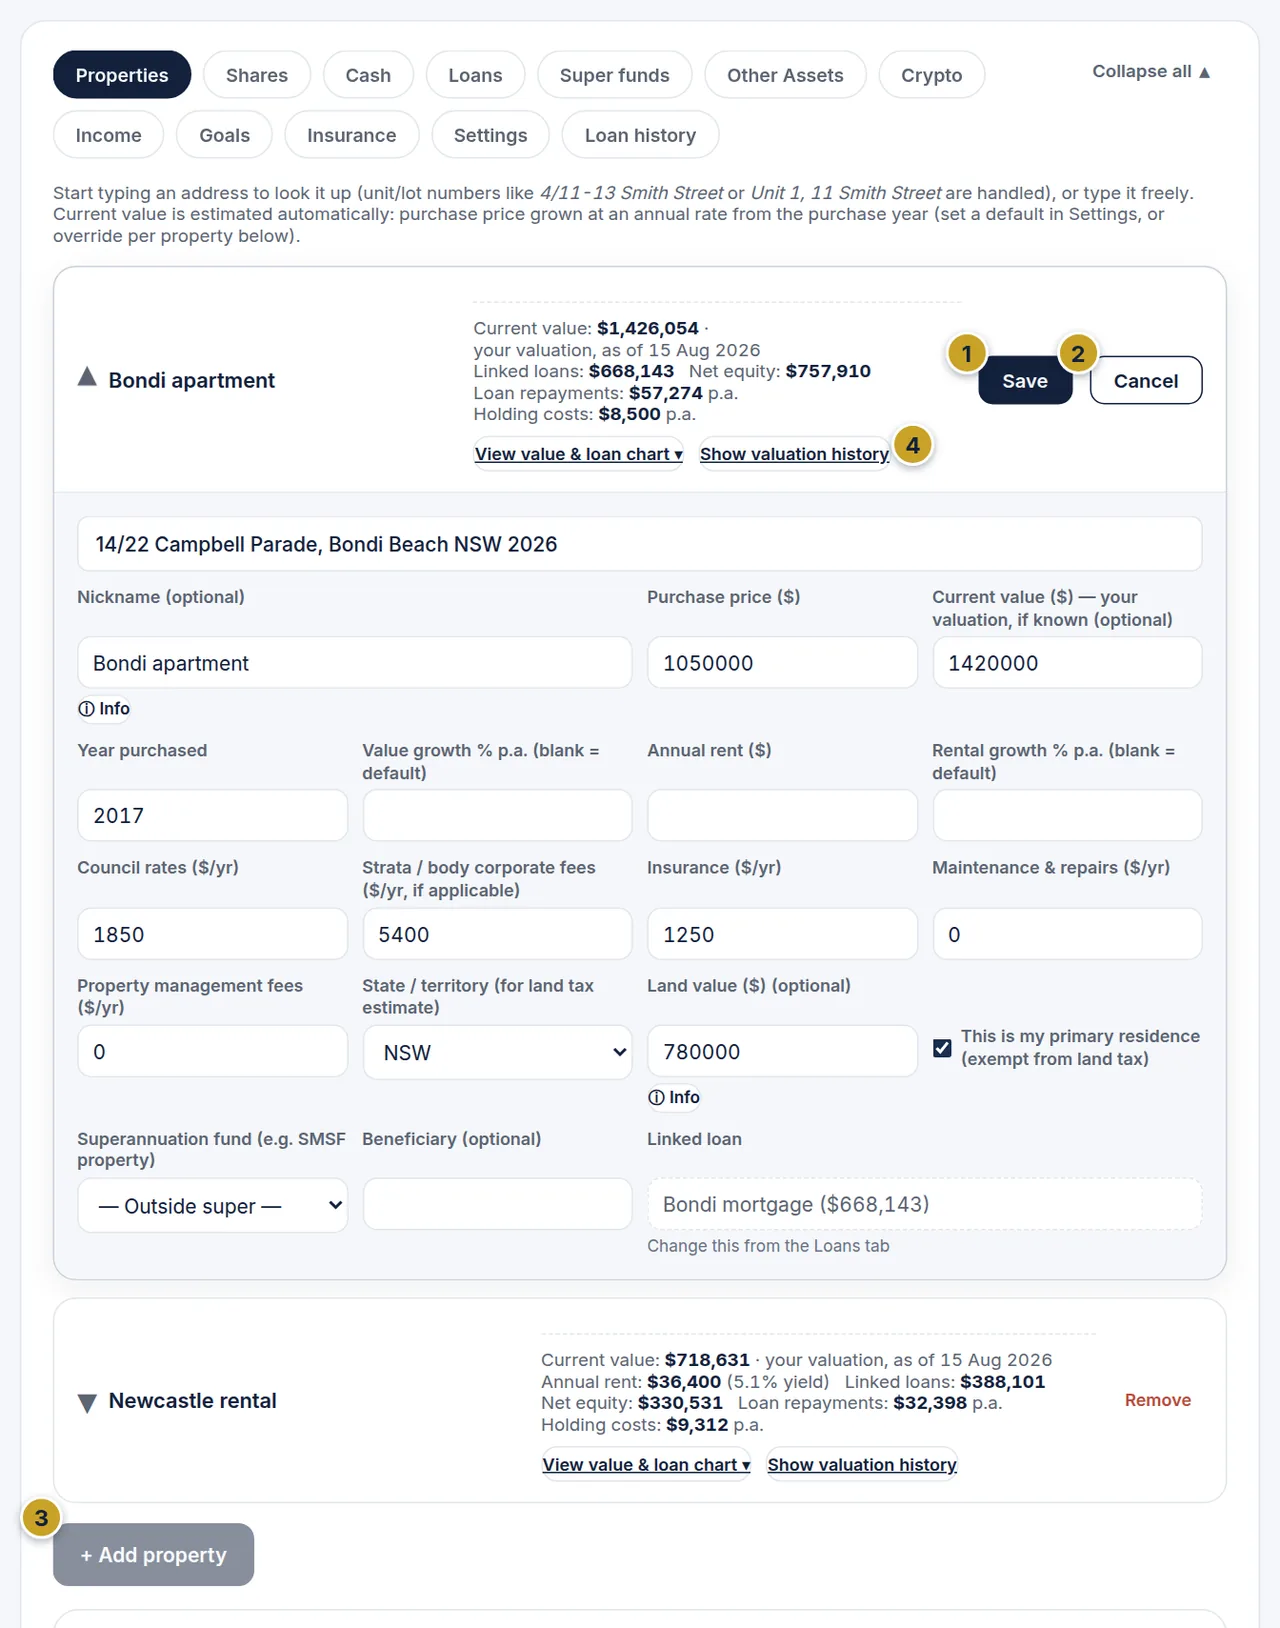
- Save
- Cancel
- + Add property (greyed out while editing)
- Show valuation history
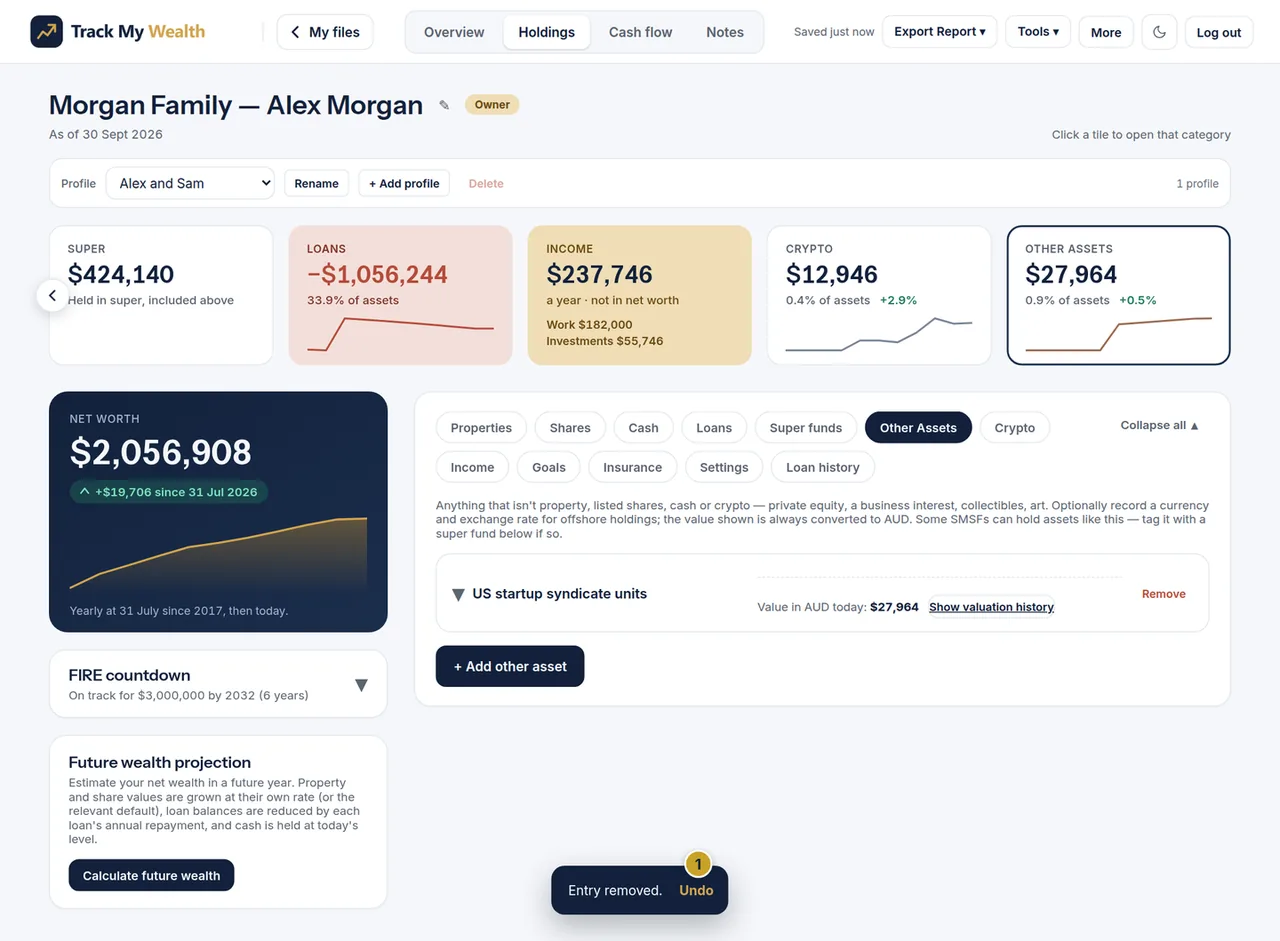
- Undo
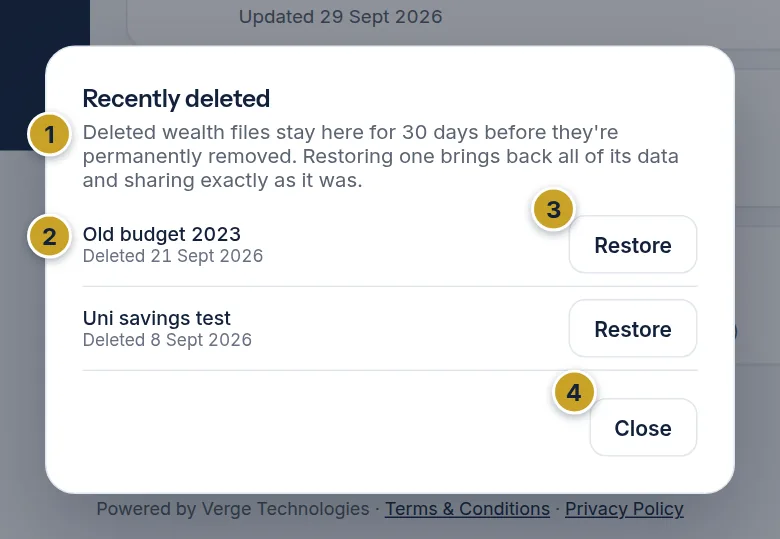
- 30-day recovery note
- Deleted file and date
- Restore
- Close
Properties
Start typing an address and pick it from the suggestions (unit/lot numbers are handled), or just type it freely if the lookup doesn't find it.
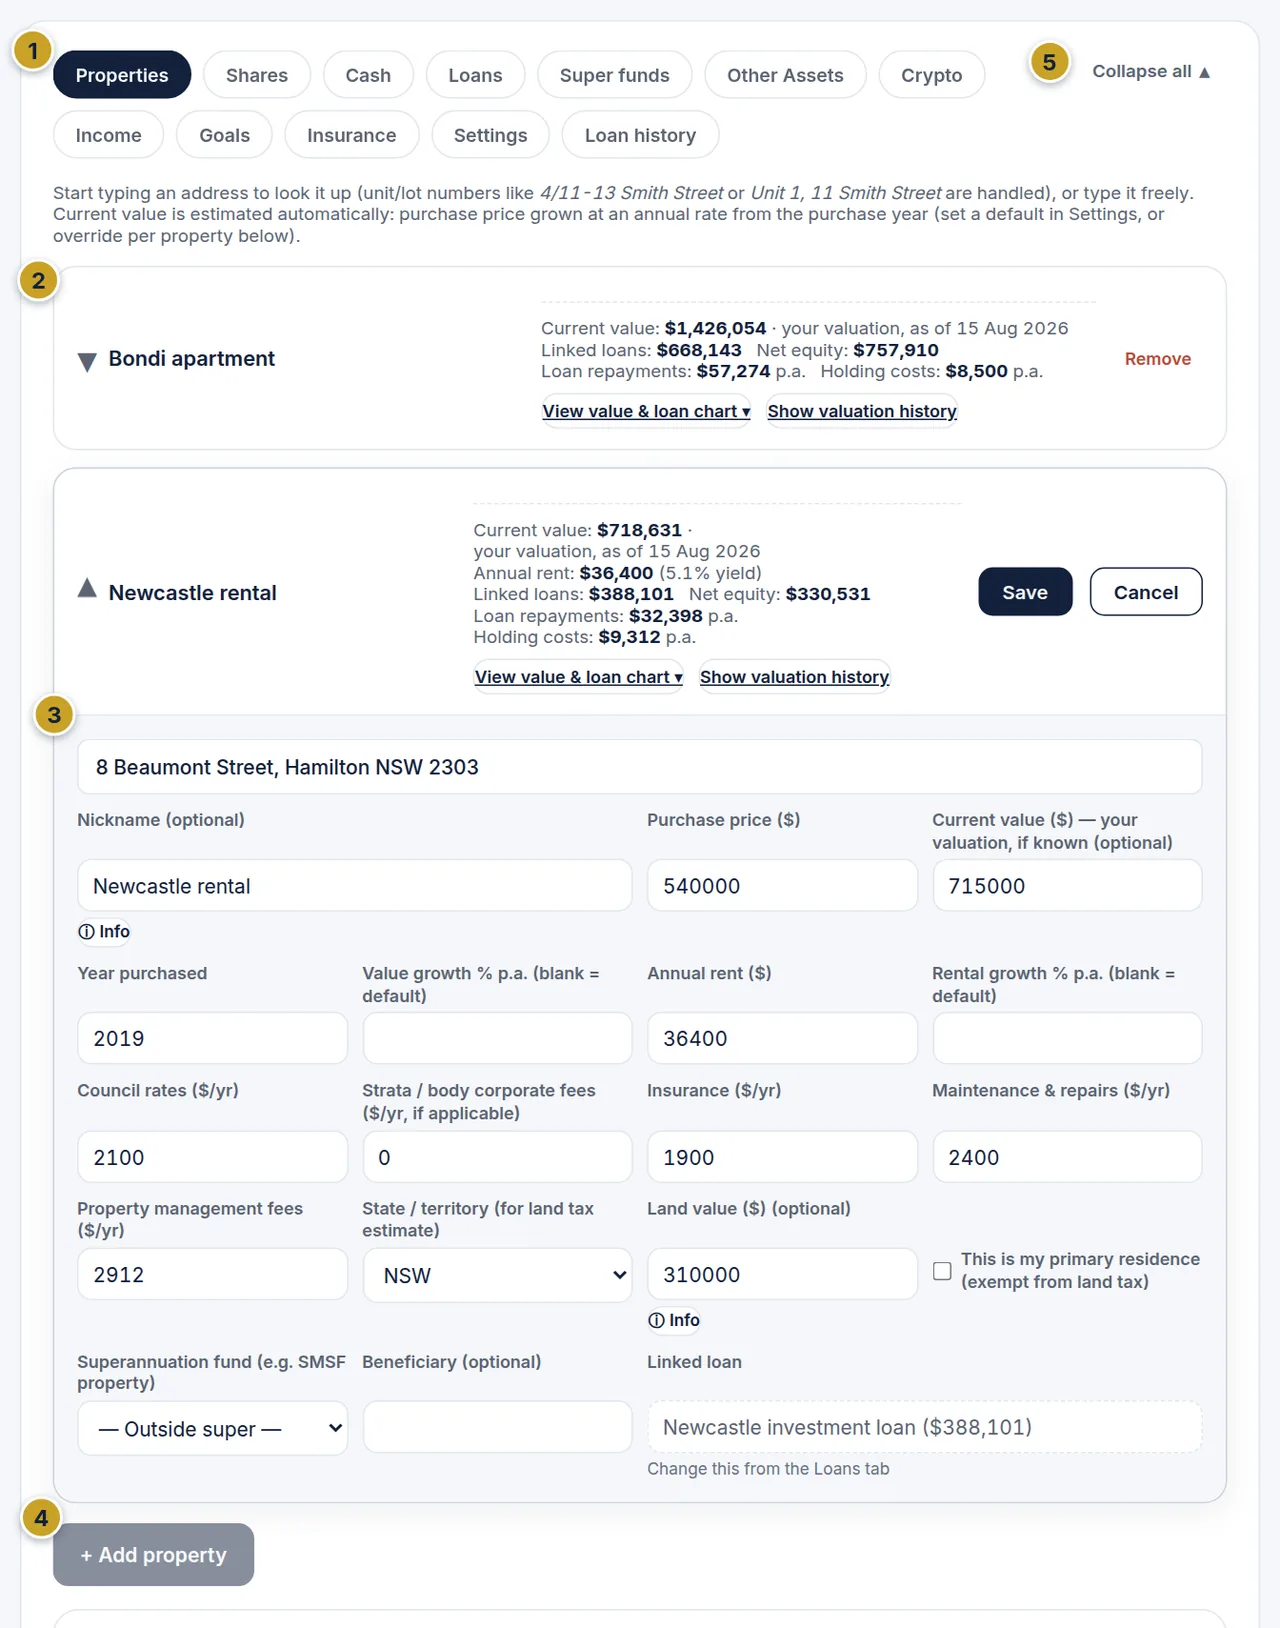
- Category tab bar
- Collapsed entry
- Expanded entry details
- + Add property
- Collapse all
- Purchase price & purchase year — the anchor for everything else about this property.
- Growth rate — per-property, or leave blank to use the default rate set in Settings.
- Current value + as-of date — an optional fresh valuation (from an agent, a bank, or your own estimate). Once entered, Track My Wealth works out the real compound growth rate implied between your purchase price and this valuation, and uses that rate for the whole curve — past and future — instead of the flat default rate.
- Rent, holding costs, and a linked loan — annual rent (for yield and cash flow), council rates/strata/insurance/maintenance/management fees (for the true holding cost), and linking a loan so its balance is deducted from this property's equity.
- Primary residence — tick this to exclude the property from the land tax estimate. It is also left out of the Capital gains tab.
- Contract date, buying costs and newly built (Australia) — used by the Capital gains tab and the negative gearing change from 1 July 2027.
Click "Show valuation history" on a property to enter what it was actually worth in any past year — useful for modelling a real downturn (or a period of outperformance) rather than a smooth curve.
Shares
Enter the ticker (ASX is assumed — e.g. VAS or CBA — add a suffix like AAPL for a US ticker) and how many units you hold.
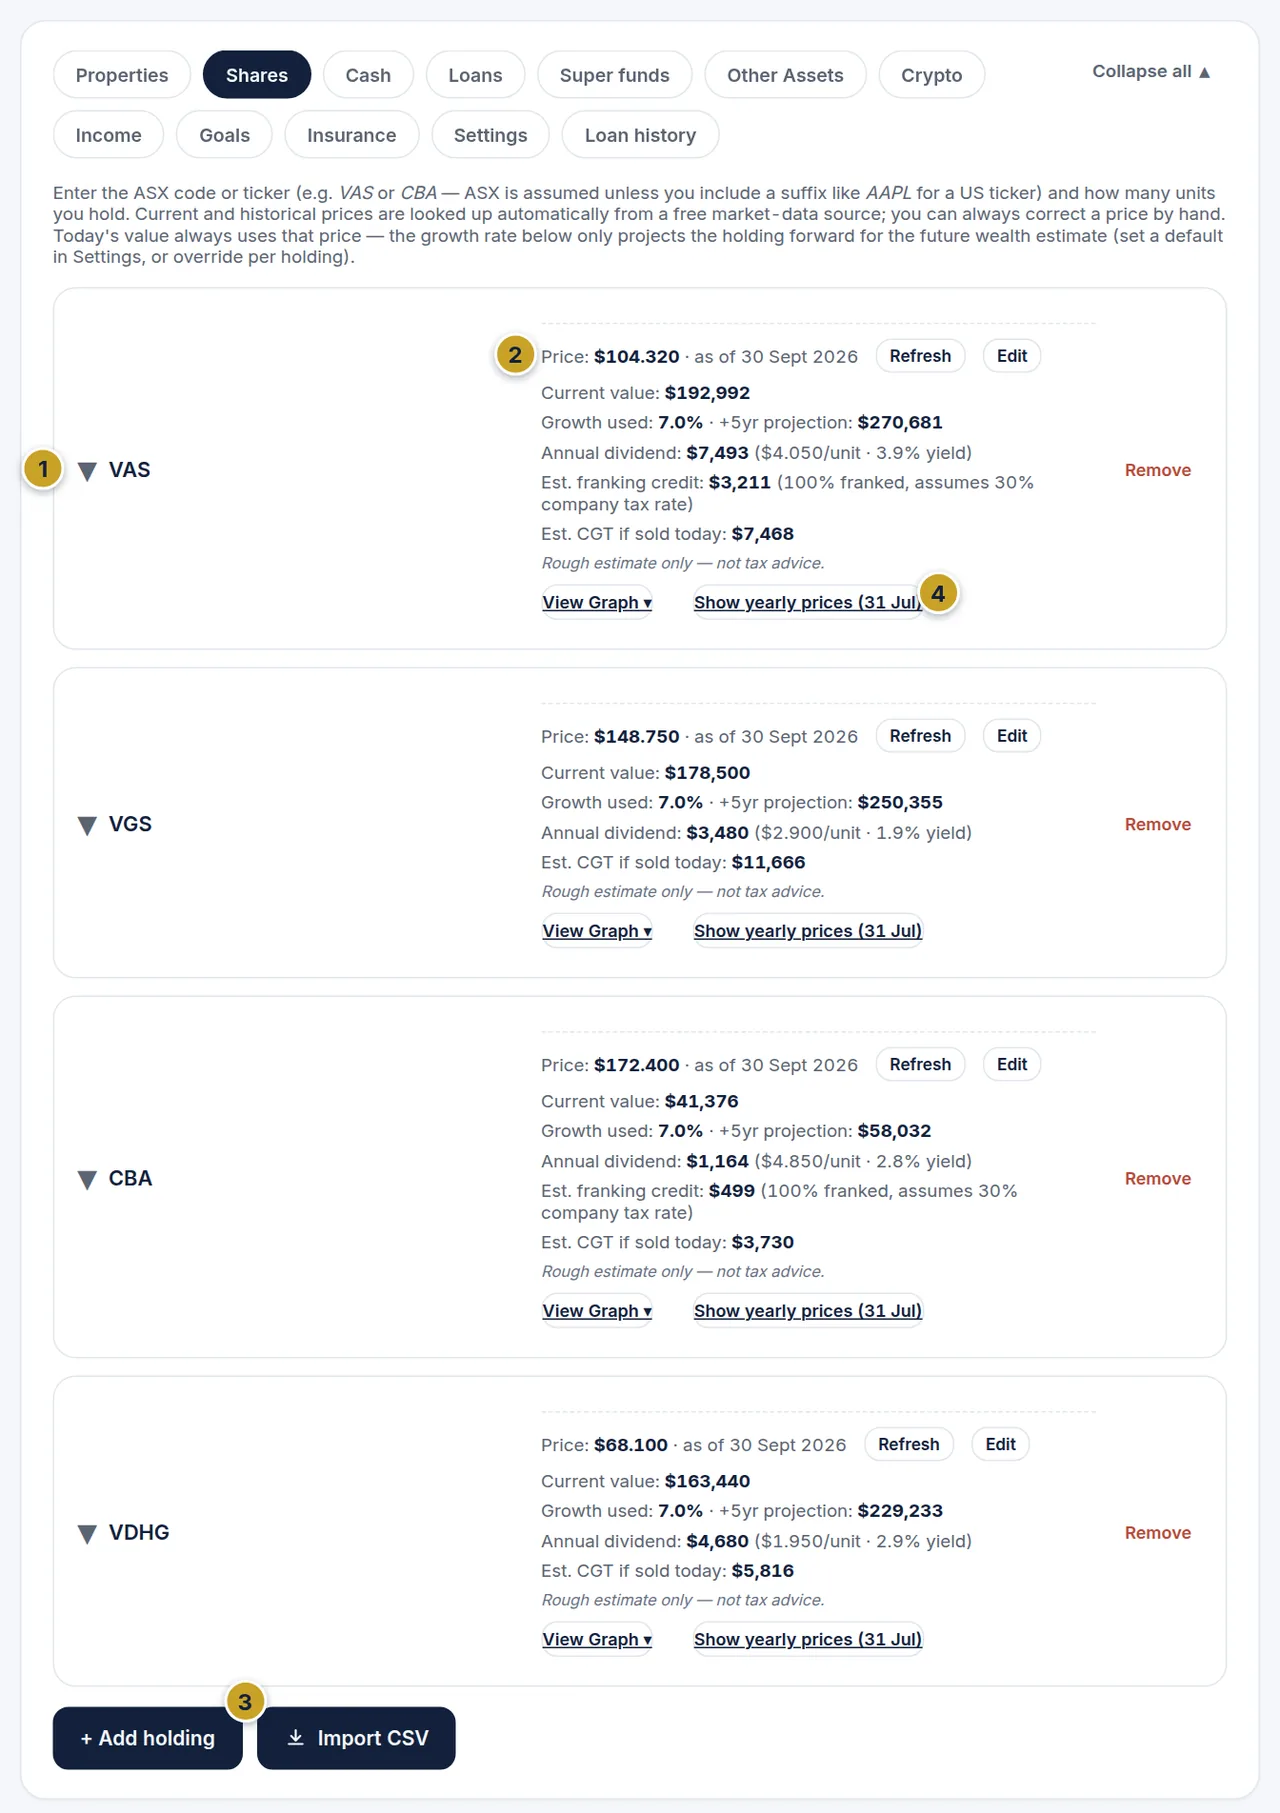
- Ticker
- Current price
- Import CSV
- Show yearly prices (31 Jul)
- Current price — looked up automatically from a free market-data source, and refreshed with the Refresh button on each holding; you can always overwrite it by hand if it looks wrong.
- Year acquired — lets this holding appear on the historical charts, and unlocks "View Graph" and "Show yearly prices (31 Jul)".
- Yearly prices — click "Refresh all years" to auto-fill from historical market data, or type a figure in yourself for a year the lookup can't find (shown as $67.42-style currency, not a raw number).
- Dividends & franking — each holding shows its estimated annual dividend, yield and franking credit, and an estimated capital gains tax if sold.
- Growth rate — only used to project this holding forward for future-wealth estimates; today's value always comes from the live/manual price, never the growth rate.
- Import CSV — bulk-add holdings exported from a broker or spreadsheet, rather than one at a time.
Importing shares from a CSV file
Click Import CSV and choose a file to add many holdings at once. The first row must be a header row naming each column, and each row after it is one holding. Columns can be in any order, but the layout below is the easiest to copy.
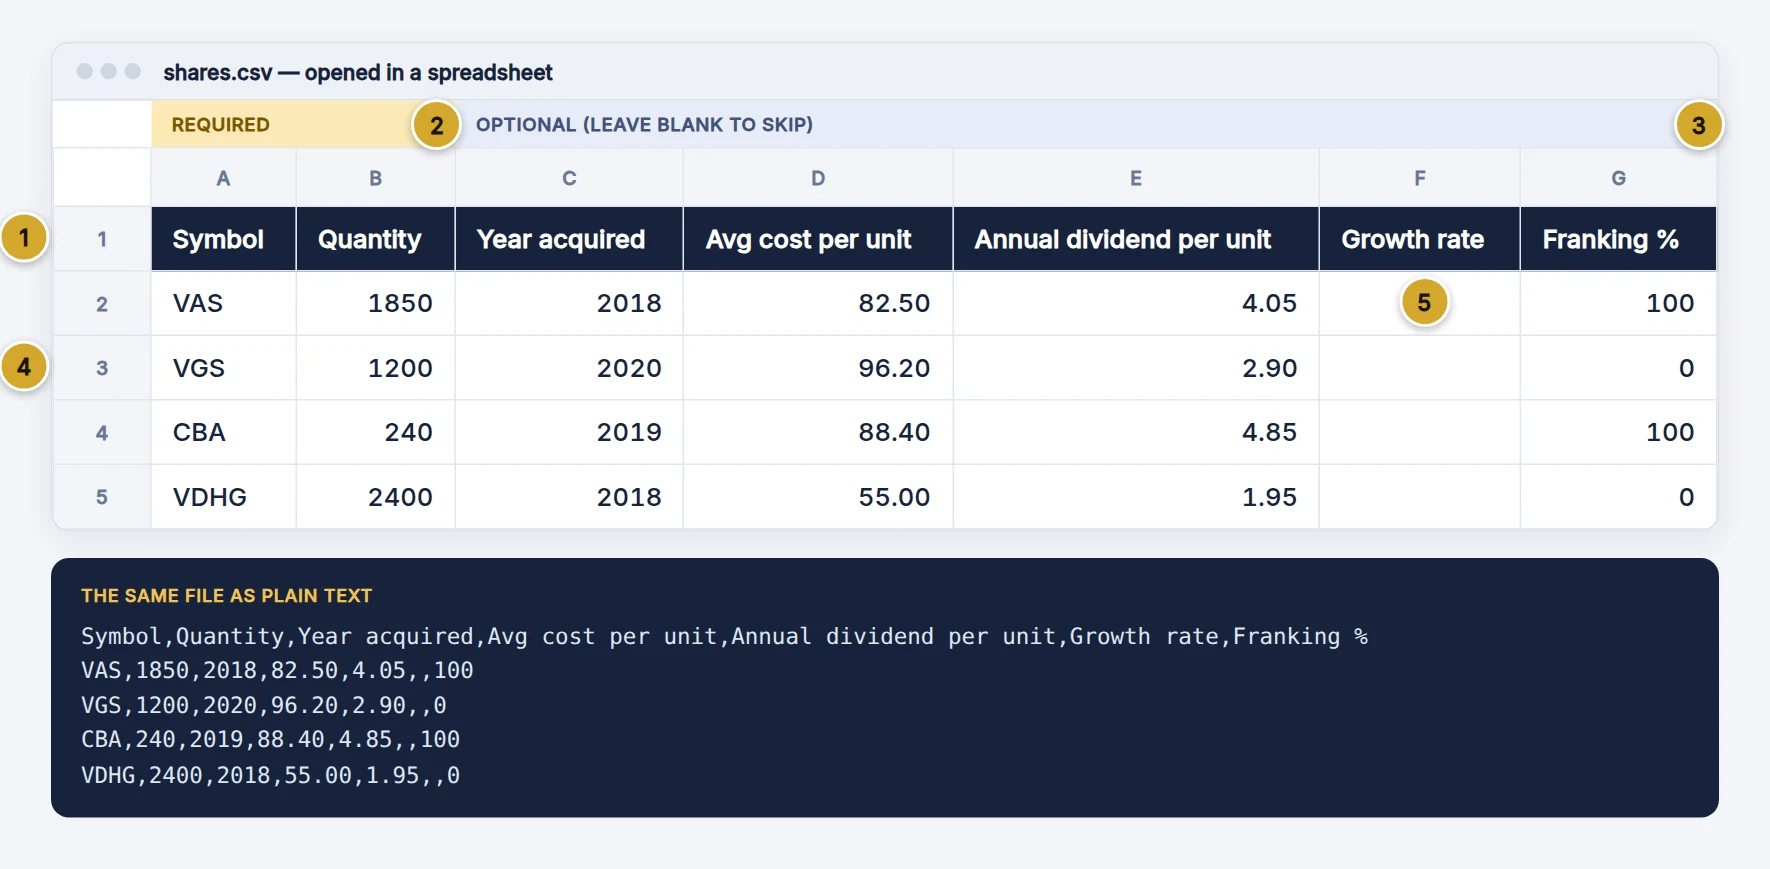
- Header row
- Required columns (Symbol, Quantity)
- Optional columns
- One holding per row
- Blank cells are fine
- Required — Symbol and Quantity. A row missing either is skipped.
- Optional — Year acquired, Avg cost per unit, Annual dividend per unit, Growth rate and Franking %. Leave a cell blank if you don't know it.
- Prices — you don't need a price column. Current prices are looked up automatically after the import.
- Existing holdings — imported rows are added alongside what you already have; nothing already in the file is changed.
Download this sample CSV and replace the rows with your own holdings.
Cash
Bank accounts, term deposits, offset accounts and similar.
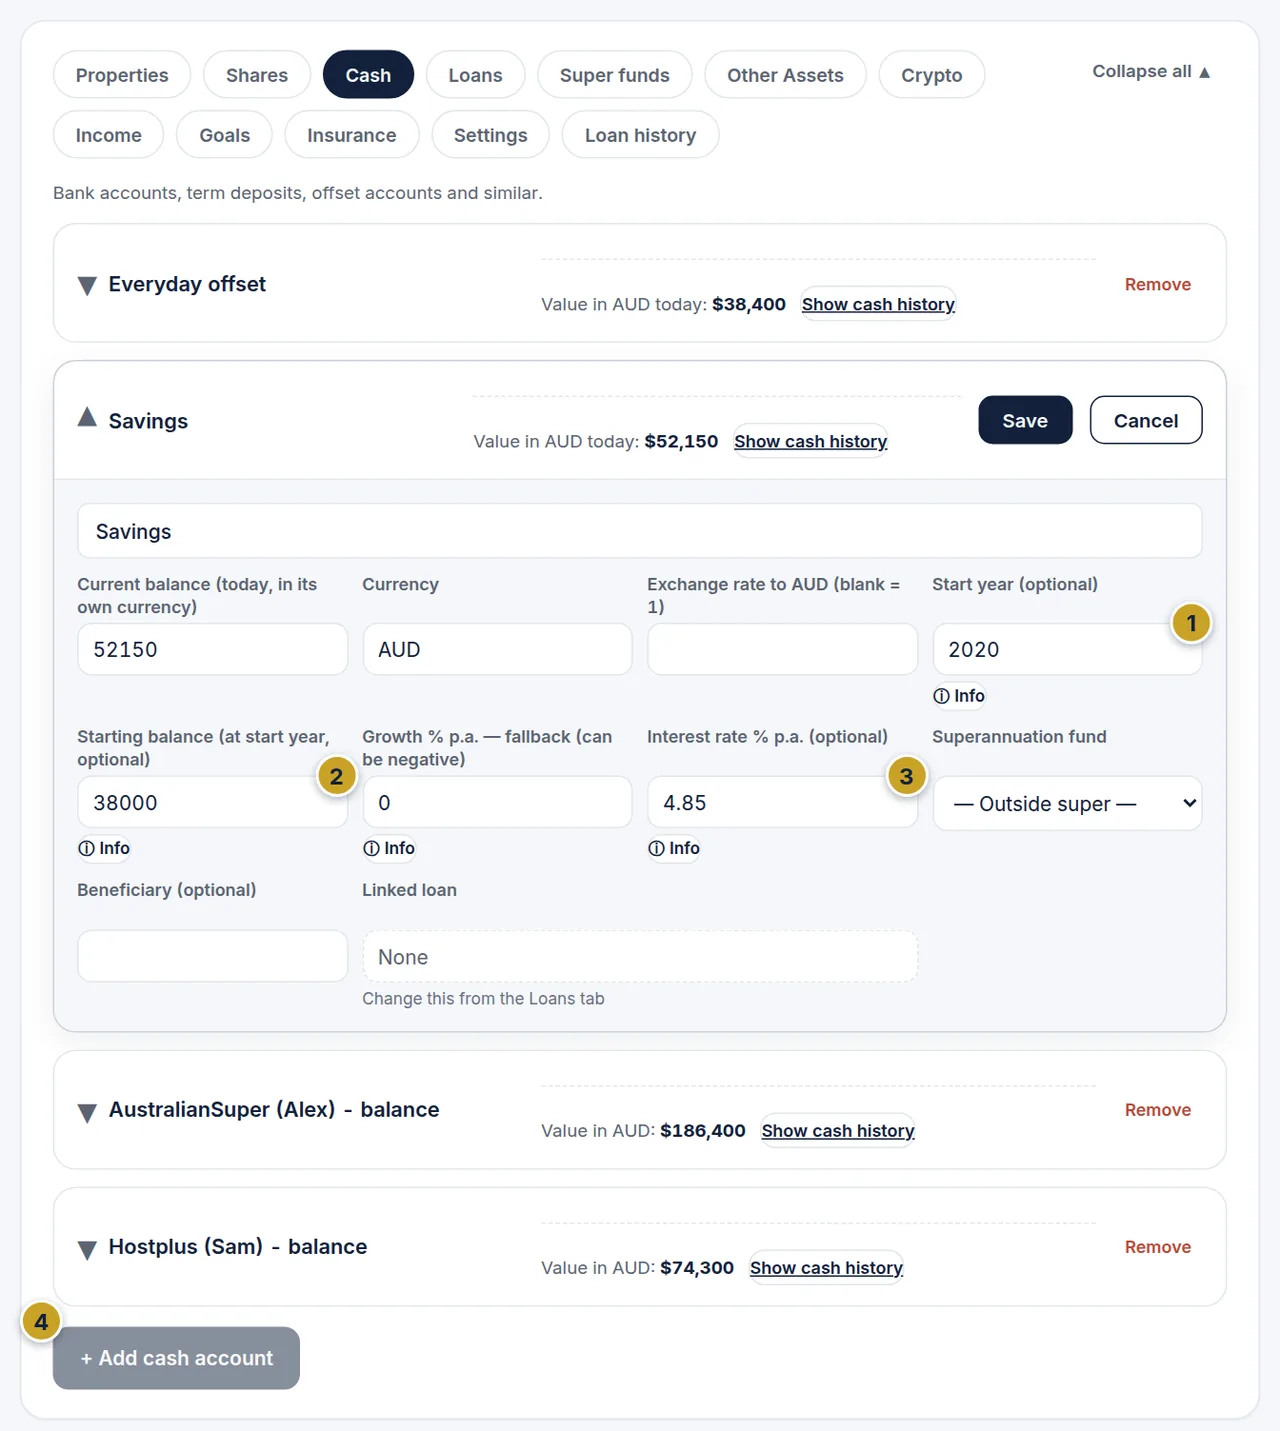
- Start year
- Starting balance
- Interest rate
- Add cash account
- Current balance — today's actual balance, in the account's own currency (convert to AUD with the exchange-rate field if it's a foreign account).
- Start year + starting balance — both optional, for an account that's been running for years. Enter what it actually held back then, and Track My Wealth works out the real growth rate between that figure and today's balance automatically — same idea as the property valuation-history fix above. Leave "Starting balance" blank and the "Growth %" field is used instead as a fallback.
- Interest rate — drives the interest income shown on the Cash Flow view.
- Show cash history — click this on any account to enter its real balance for a specific past year, overriding the estimate for just that year (the same override pattern properties and other assets use).
Loans
Mortgages, lines of credit and other debts. Balances are deducted from total wealth; annual repayments are deducted from your net income figure on the home screen.
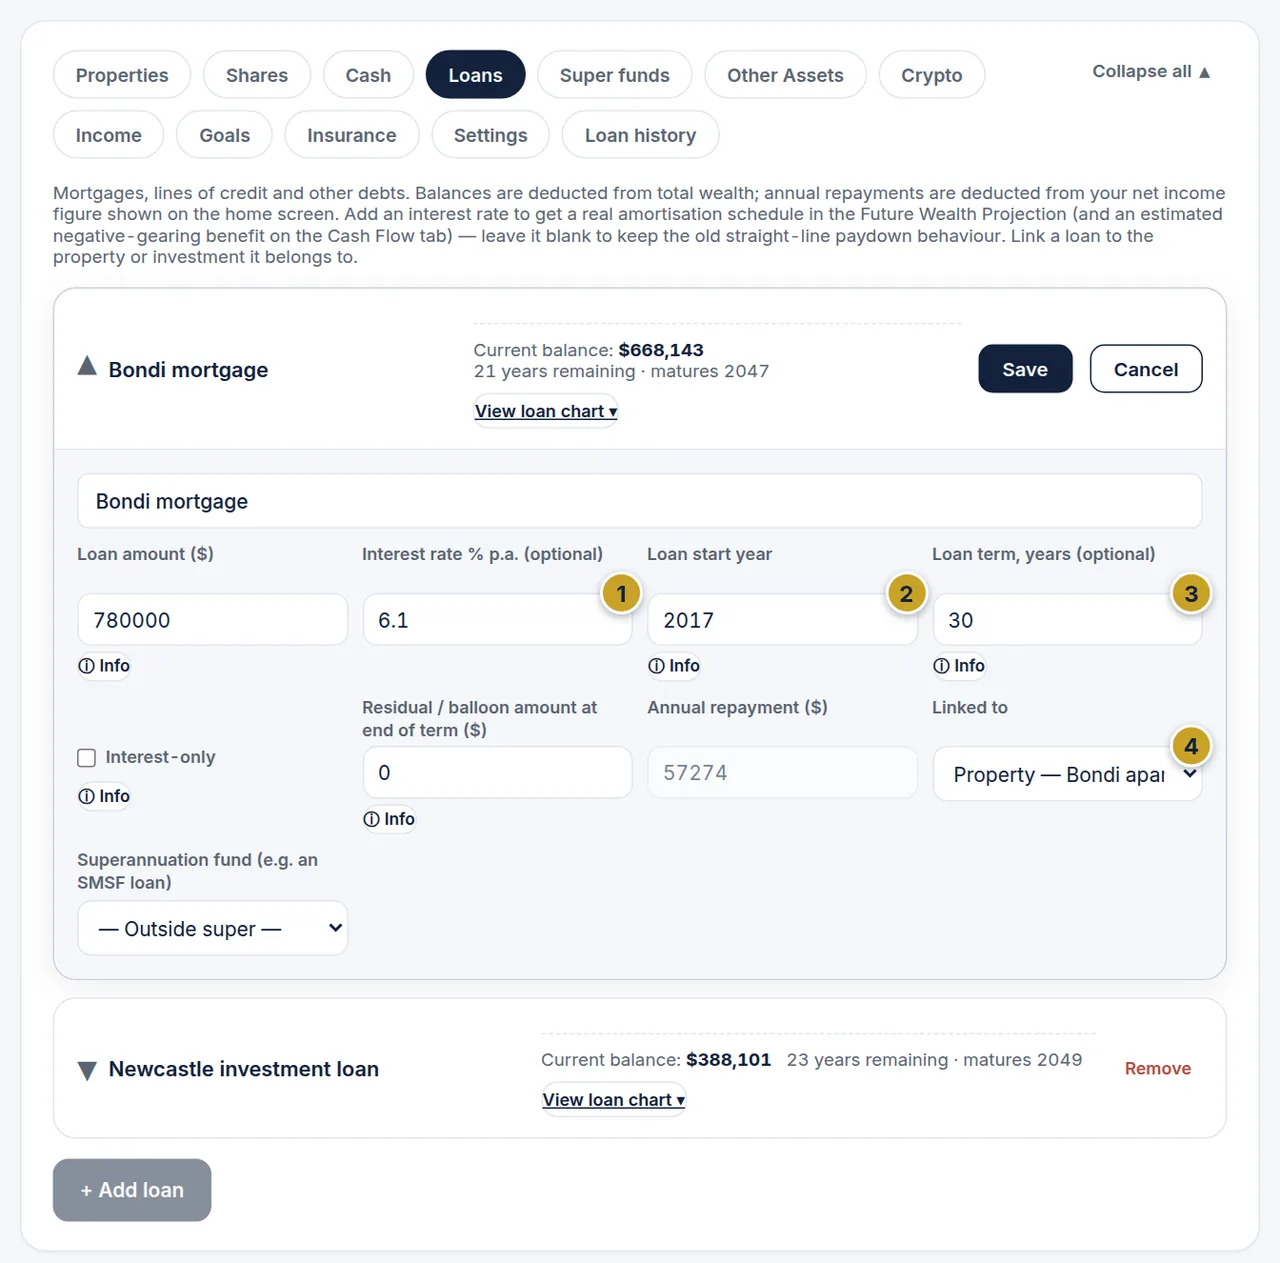
- Interest rate
- Loan start year
- Loan term
- Linked to (property)
- Interest rate + start year + term — set all three for a real amortisation schedule (in the future wealth projection) instead of a straight-line paydown, and an estimated negative-gearing benefit on the Cash Flow view. Once these are set, "Loan amount" on the form means the amount originally borrowed, not today's balance — Track My Wealth calculates today's balance for you.
- Link to a property or other asset — so its balance is deducted from that specific holding's equity, and its repayments show against that property's cash flow.
- View loan chart — shows the balance paying down (or staying flat, if no term is set) over time.
The Loan history tab (separate from this one) lets you set a combined loans total for a specific past year, for when the per-loan amortisation estimate isn't accurate enough — e.g. an early repayment or redraw a term-based schedule wouldn't know about.
Other Assets
Anything that isn't property, listed shares, cash or crypto — private equity, a business interest, collectibles, art.
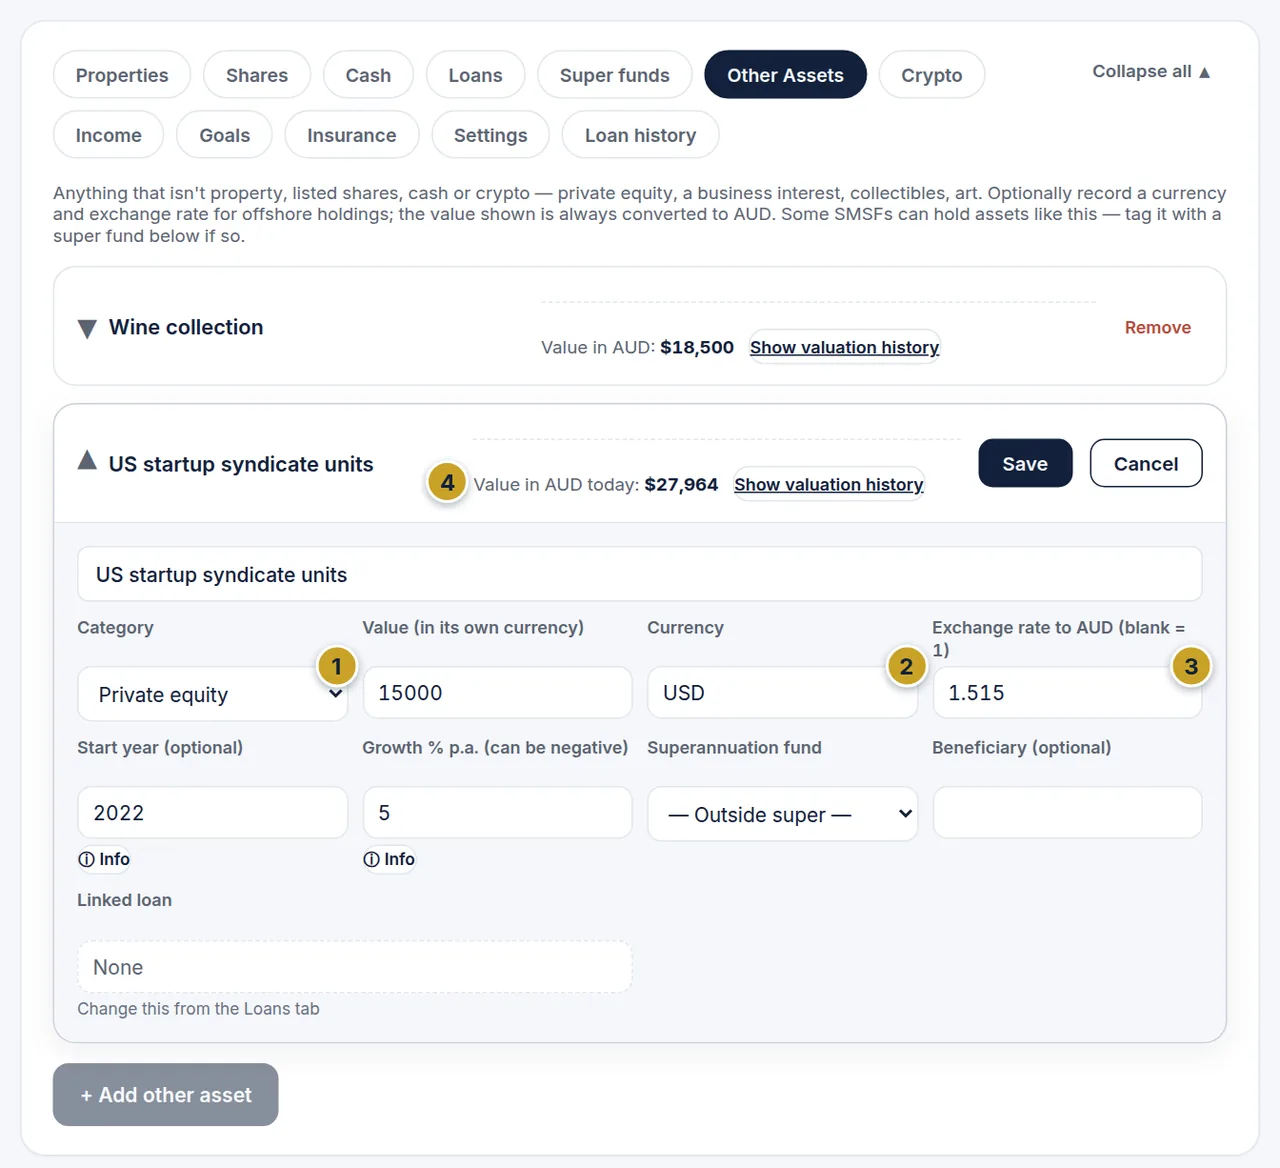
- Category
- Currency
- Exchange rate to AUD
- Value in AUD today
Works the same way as Cash and Properties: choose a category, add a currency and exchange rate for offshore holdings (the value in AUD today is worked out for you), set a growth rate, and — with a start year set — use "Show valuation history" to enter real past figures.
Crypto
Enter the coin's ticker (e.g. BTC or ETH) and how many units you hold. Prices are looked up automatically in USD and converted to AUD at a live exchange rate; press Look up price when adding a new holding.
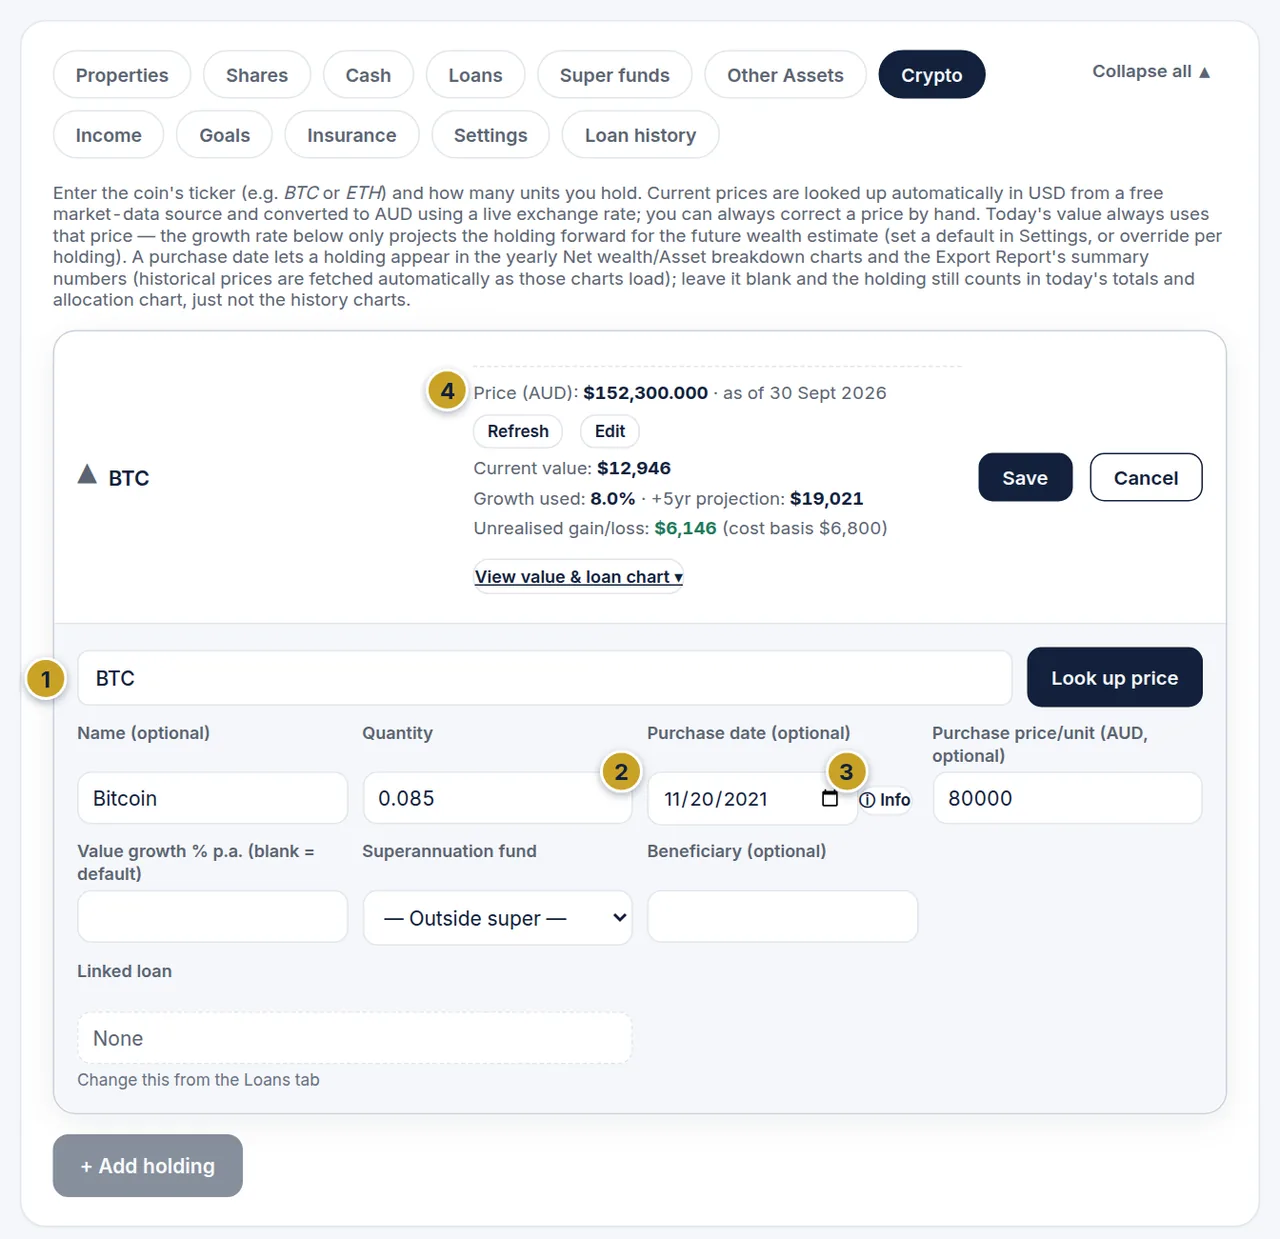
- Ticker
- Quantity
- Purchase date
- Current price (AUD)
Set a purchase date to have this holding appear in the historical Net Wealth and Asset Breakdown charts (and the Export Report's summary) — without one, it still counts in today's totals and the allocation chart, just not the history charts. Crypto is far more volatile than shares or property, so treat its growth rate as a rough planning assumption, not a forecast.
Super Funds
Superannuation isn't its own asset type — a super balance is always property, shares, cash or another asset sitting inside a fund.
- Add each of your super funds here (an SMSF, or an industry/retail fund).
- Go to Properties, Shares, Cash or Other Assets and tag the individual holdings that fund contains, using that holding's "Superannuation fund" field.
- The Current allocation chart then shows what's inside vs outside super for each category automatically.
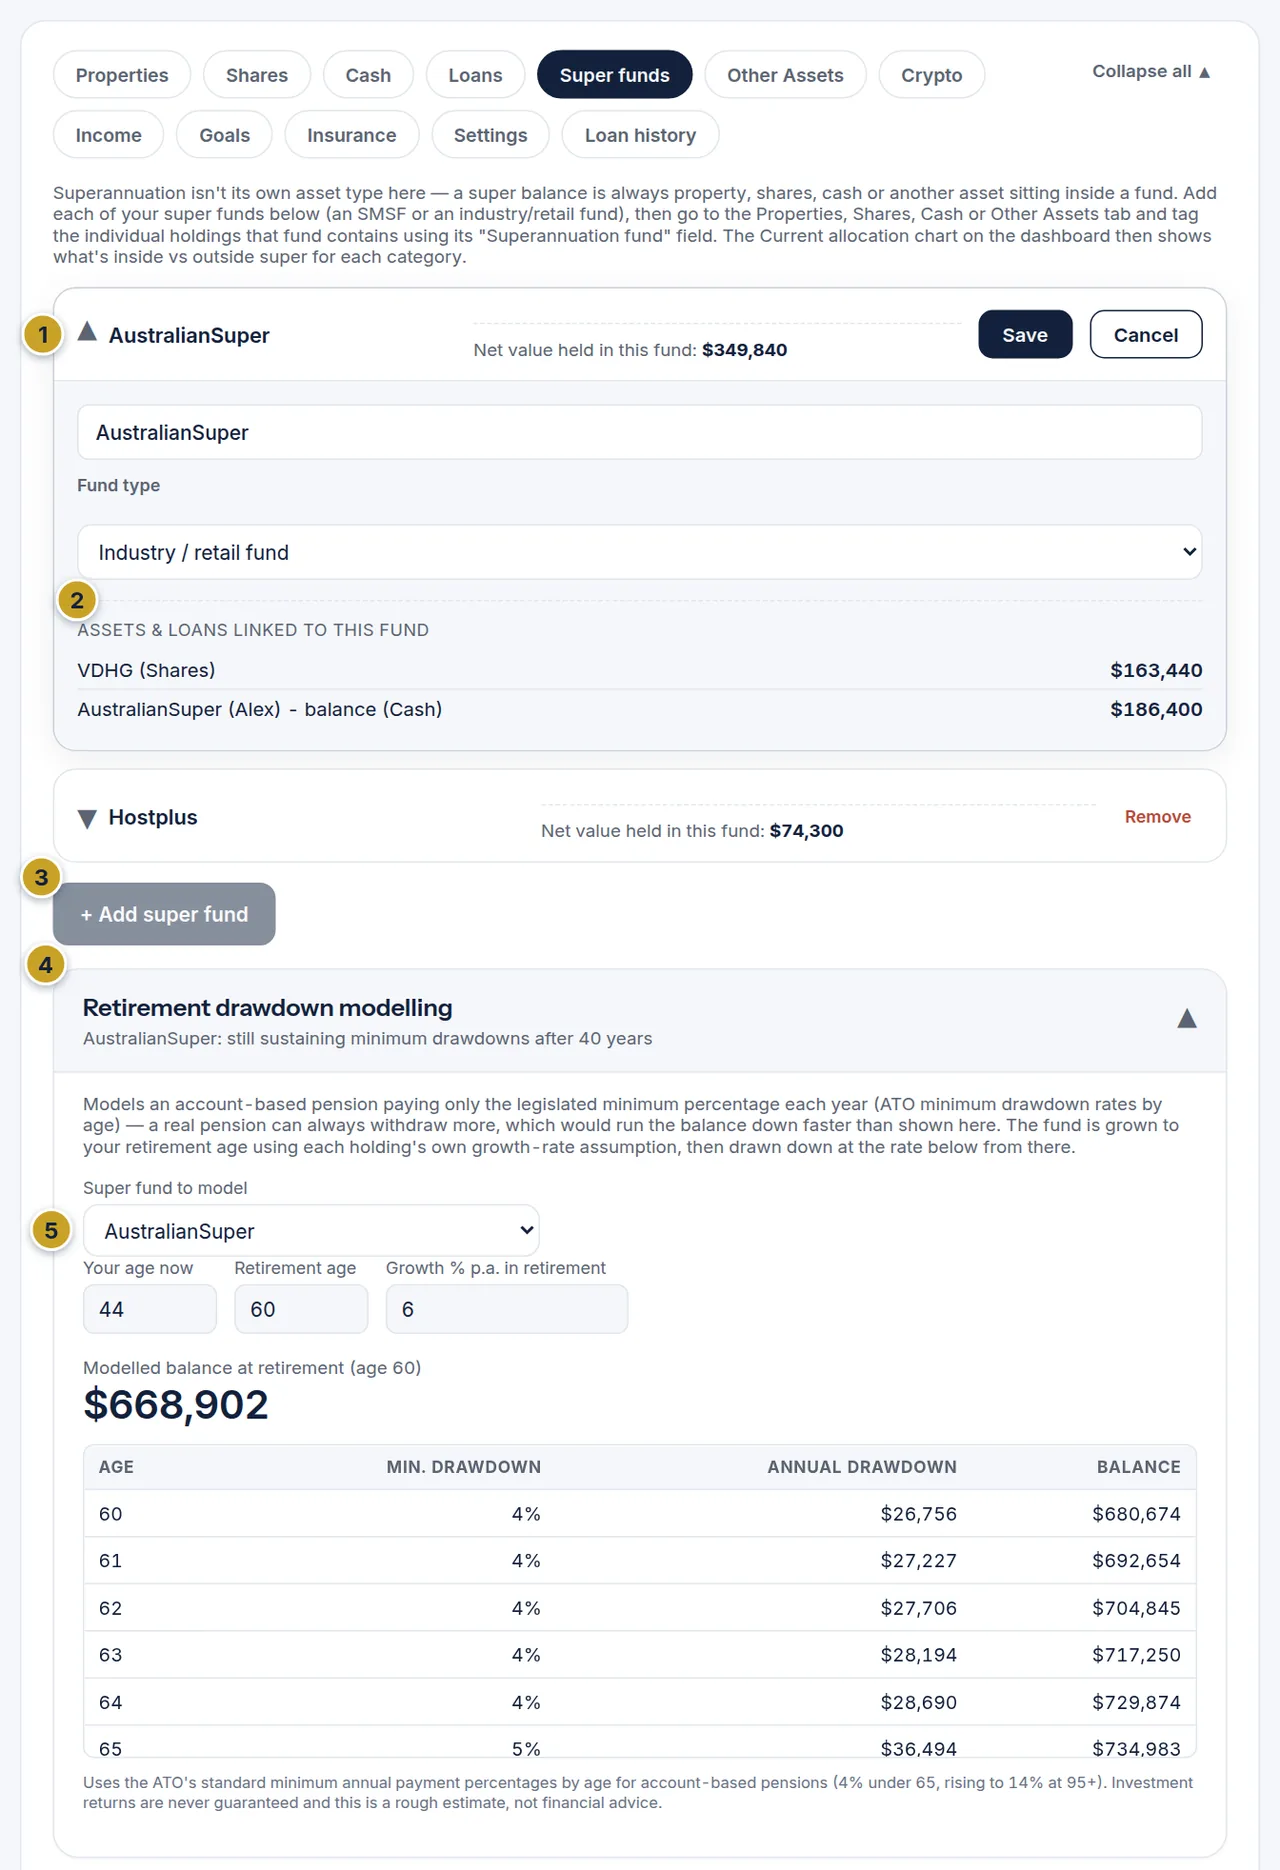
- Super fund entry
- Holdings tagged to this fund
- Add super fund
- Retirement drawdown modelling
- Fund and age inputs
The "Retirement drawdown modelling" panel on this tab (shown when your country is Australia) estimates how a chosen fund's balance draws down in retirement, paying only the legislated minimum percentage for your age each year — a real pension can withdraw more, which would run the balance down faster than shown. Enter your age now, your retirement age and a growth rate, and the table lists each year's Age, Min. drawdown (the ATO percentage), Annual drawdown (in dollars) and the remaining Balance. Scroll the table to see later years.
Retirement planner
Advanced On the Super funds tab (shown when your country is Australia) the Retirement planner estimates how long your money could last once you stop work, in today's dollars. You don't need to know what you will spend: leave spending blank and it shows the steady yearly income your money could support until the age you plan to (95 unless you change it).
- Enter your year of birth and retirement age. Your age is worked out from the year, so it stays up to date by itself.
- Pay a year while working and Super contributions to retirement fill in from your Income tab (the grey "Auto" figures). Type a figure only if you want to override them.
- Tick the super funds and the holdings outside super you want counted. Your family home is left out unless you tick it.
- Optionally type Spending a year in retirement. The planner then shows the age your money runs out at that spending. With it blank, the table spends the steady amount your money can support.
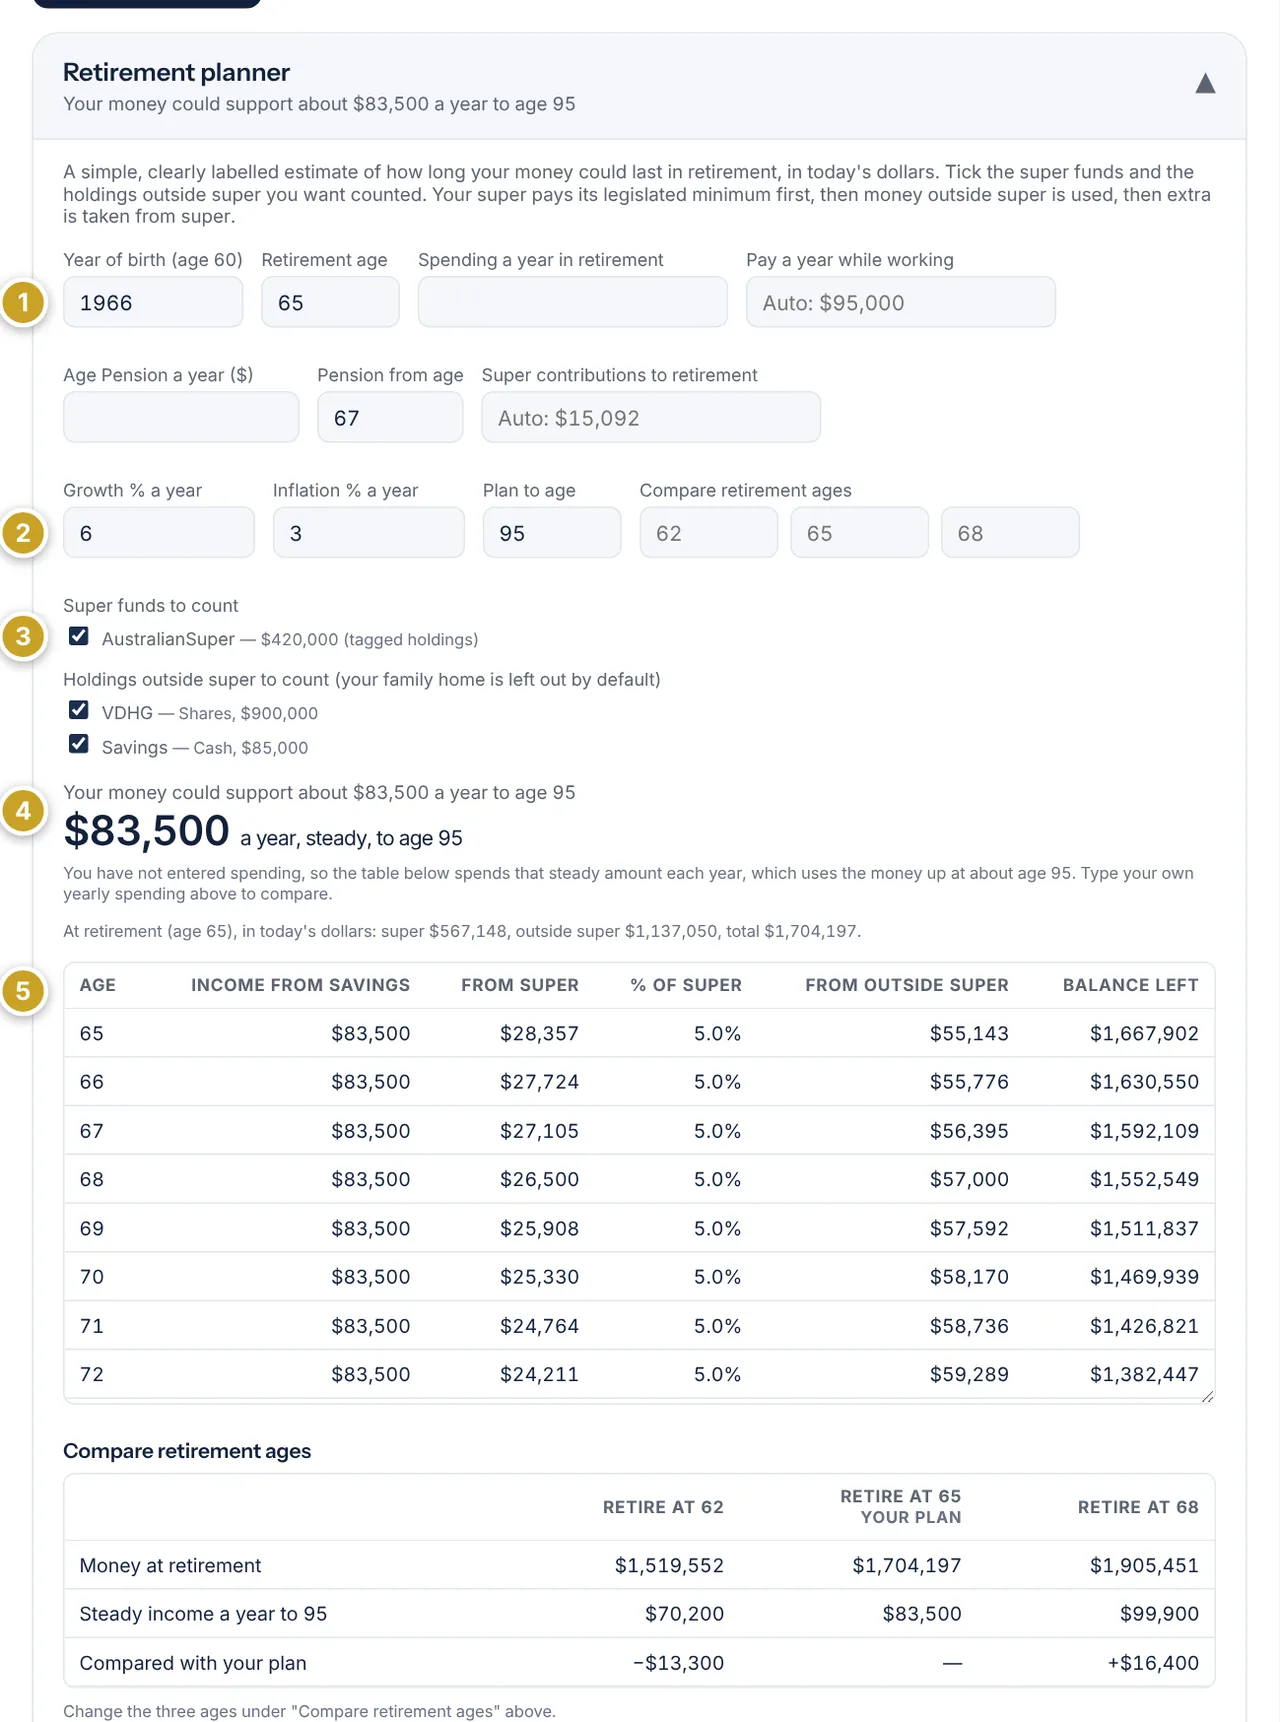
- Year of birth, retirement age, spending (optional), pay while working and super contributions
- Growth, inflation, plan-to-age and the retirement ages to compare
- Super funds and holdings counted
- Steady yearly income your money could support
- Year-by-year table
Reading the table
Income from savings is your spending less any Age Pension and pay from work. Each year your super pays at least the ATO minimum for your age first; % of super shows what share of your super balance that year's payment is. Money outside super is used next, and once it has run low more comes from super, so the split between From super and From outside super changes over the years. If the minimum is more than you need, the extra is kept and added to your money outside super. Balance left is everything remaining at the end of the year.
The Age Pension box is optional and is used exactly as you type it; the planner does not work out the means test.
Comparing retirement ages
Type up to three ages under Compare retirement ages (or leave them blank for three years either side of yours) to see, side by side, the money you would have at retirement and the steady yearly income each age supports, and how each compares with your plan. If you've typed a spending figure, it also shows when the money would run out at that spending.
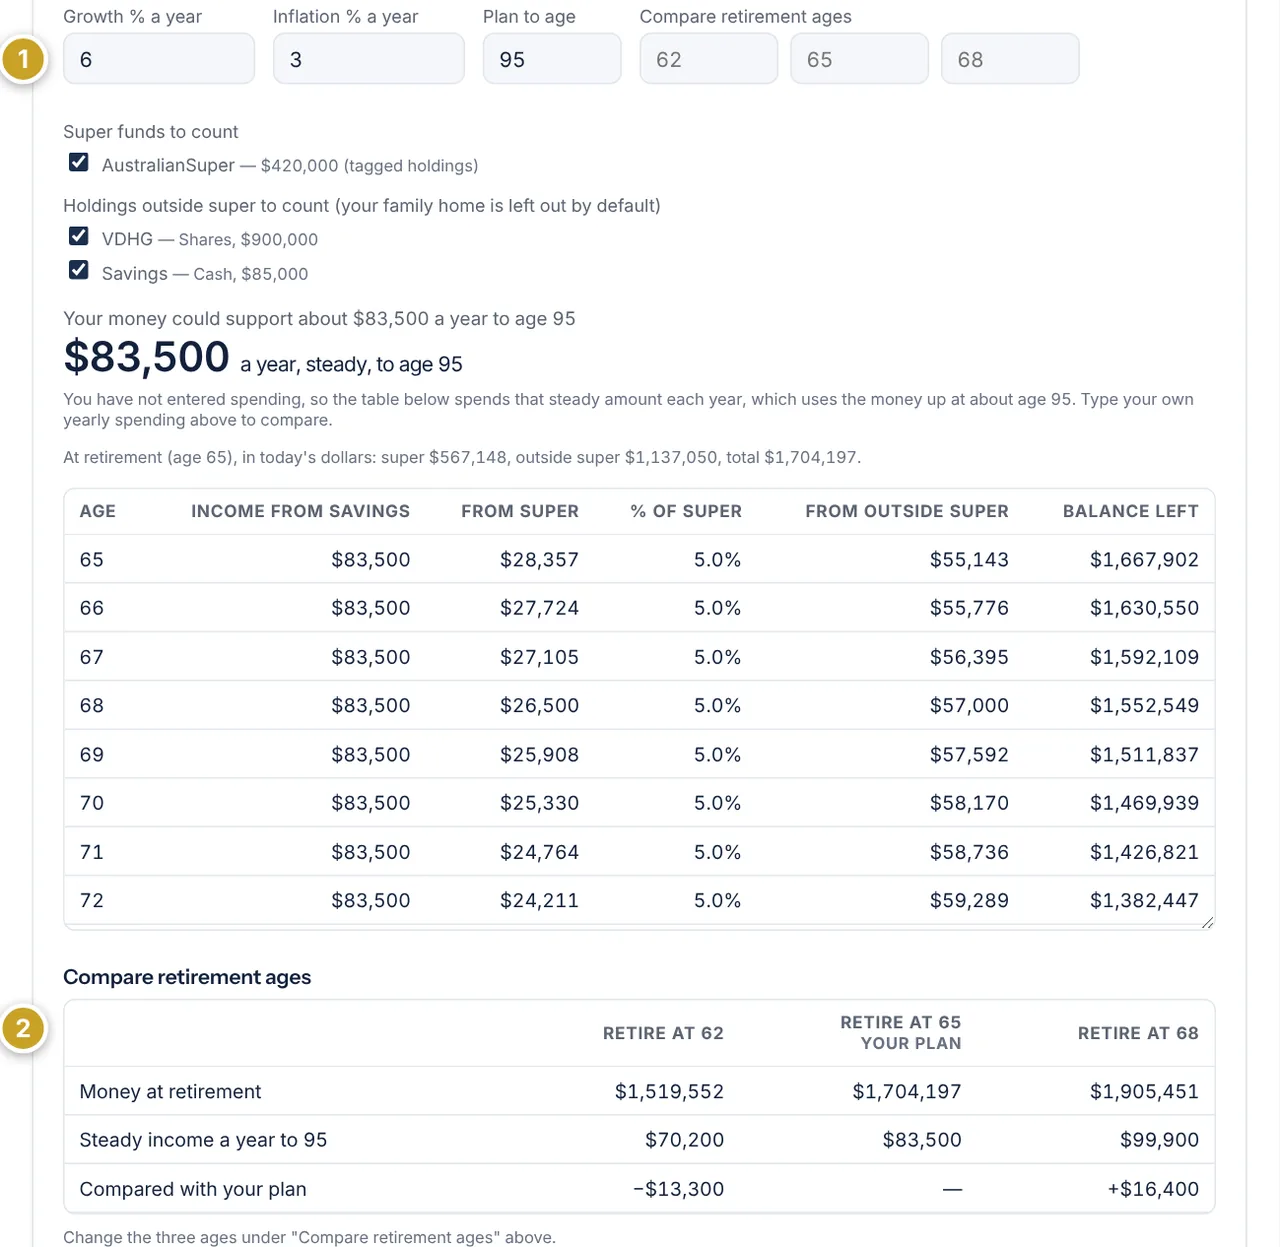
- The three ages to compare
- Comparison table
Couples and the Combined view
Each person enters their own year of birth, retirement age, Age Pension and income on their own profile. Choose Combined in the profile switcher and the planner combines every profile's super and ticked holdings into one household plan. When the first person retires, the other's pay covers part of the spending and only the retired person's super is drawn; once both have retired the full spending applies. Growth, inflation and plan-to-age come from the first profile's settings, and the card says so. In Combined, the retirement ages being compared move for everyone by the same number of years as the first person's.
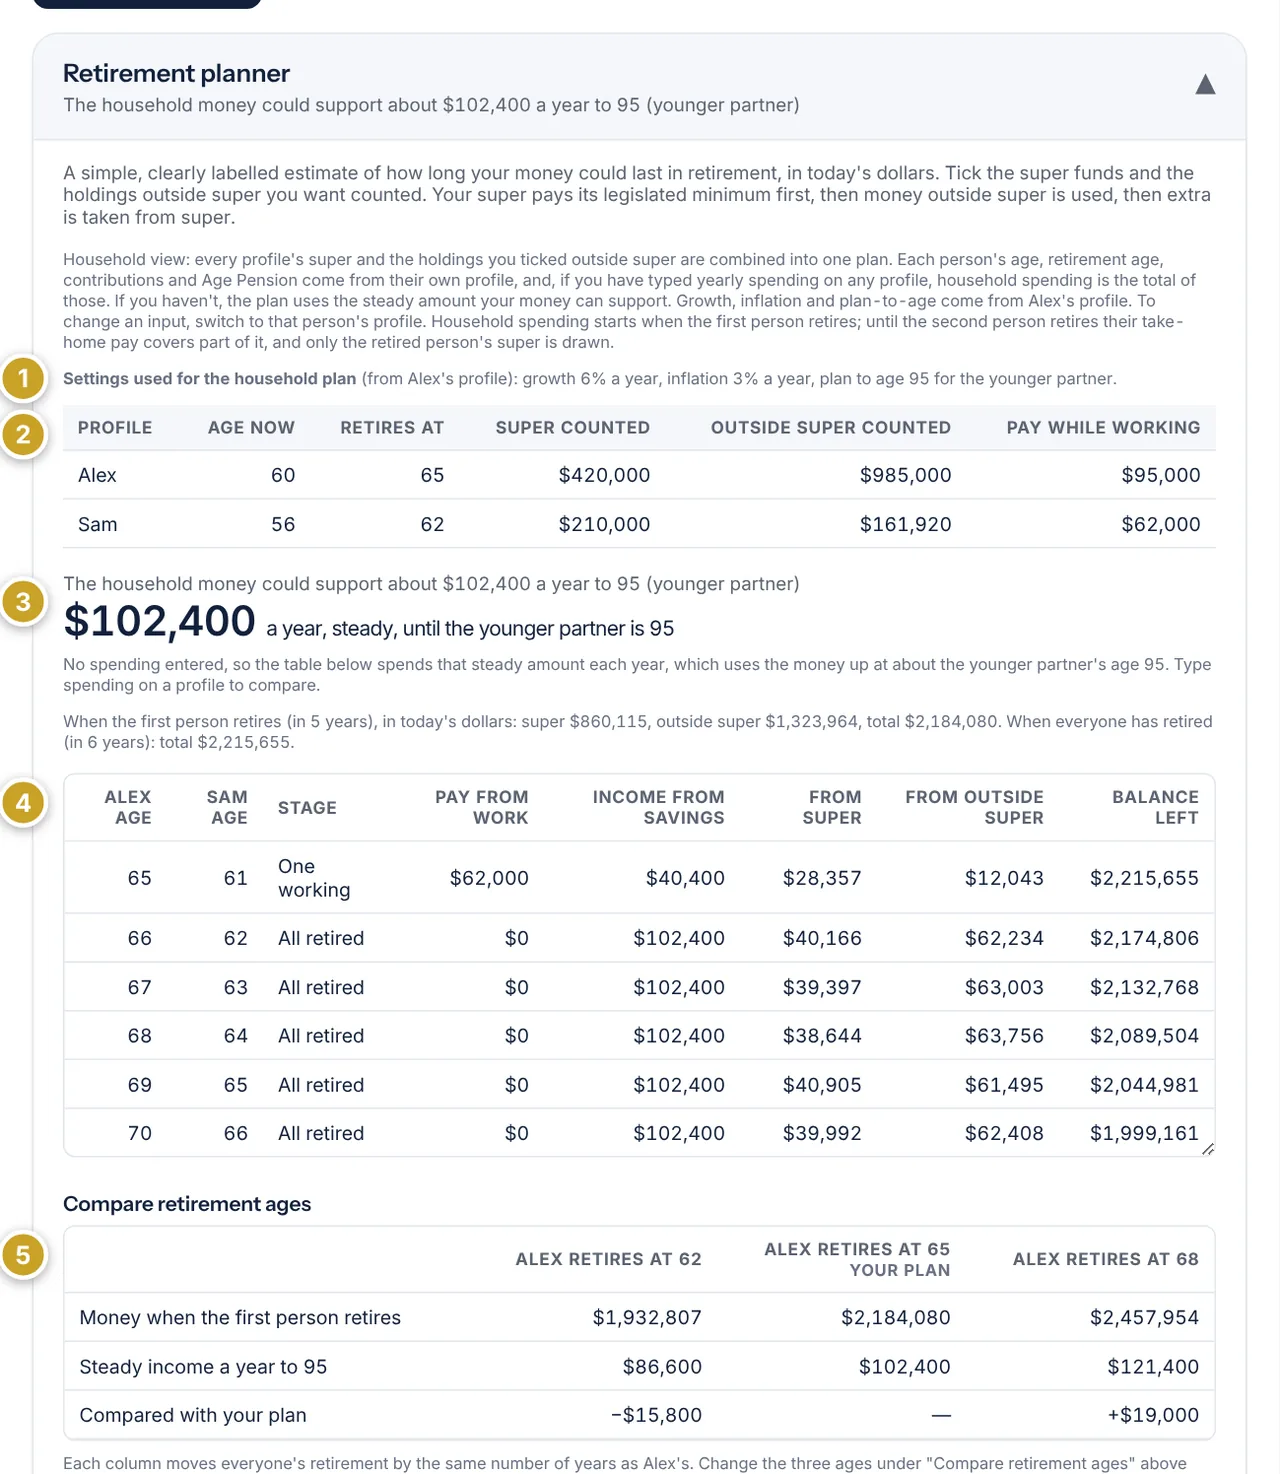
- Settings used for the household plan
- Each person's inputs
- Household headline
- Year-by-year table
- Compare retirement ages
Retirement cash flow and your report
Once the planner has an age and a retirement age, the Cash Flow tab shows a Retirement cash flow chart: spending is the line, and the bars show how each year is paid for (pay from work, Age Pension, super, and money outside super). The full Export Report adds a Retirement planner page with the headline, the inputs used, the chart, the table and the age comparison.
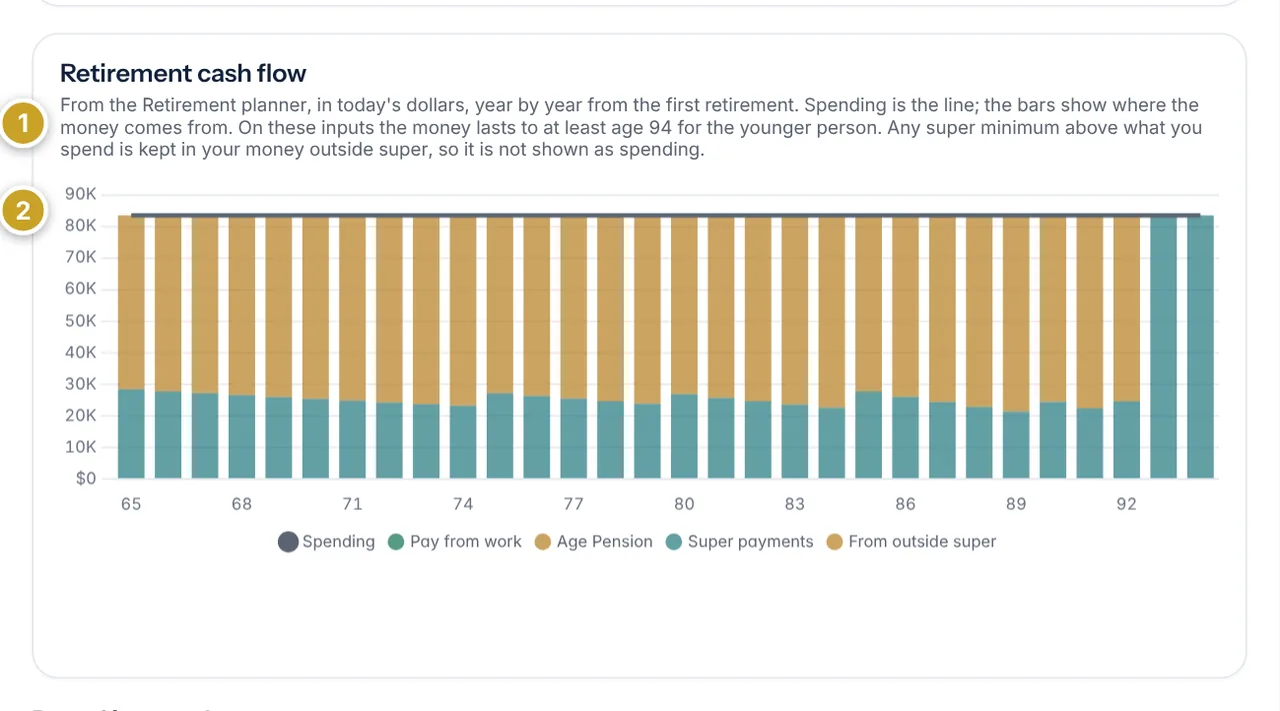
- What the chart shows
- Spending line and the sources of money
What the planner leaves out
This is a rough estimate, not financial advice. Growth is one steady rate (after inflation), so a property you tick is treated like any other savings: it is drawn down as needed and its rent is not counted separately. The planner does not model the Age Pension means test, tax, fees, aged care costs, lump sums, or the death of a partner, and returns are never guaranteed.
Capital gains
Advanced The Capital gains tab (shown when your country is Australia) works out the capital gain on each sale you log, by financial year (1 July to 30 June). Log your buys and sells under each share, crypto or investment property holding. Your own home is left out because the main residence exemption is not changing.
- Under Other taxable income a year, leave the grey figure (from your Income tab) or type your own. Gains are taxed as if stacked on top of that income. Tick the box if you receive Age Pension, JobSeeker or another income support payment.
- For each holding, press + Add a buy or sell and enter the date, units, price a unit and brokerage or selling costs. Each buy is kept as its own parcel with its own date and cost.
- On a sale, choose Which units are sold: oldest first, highest cost first (usually the smallest gain), or tick the exact parcels.
- If you have not logged any buys, the quantity, average cost and year acquired on the holding card are used as one starting parcel (for shares, 1 July of the year acquired). A property uses its purchase price, buying costs and contract date from the property card.
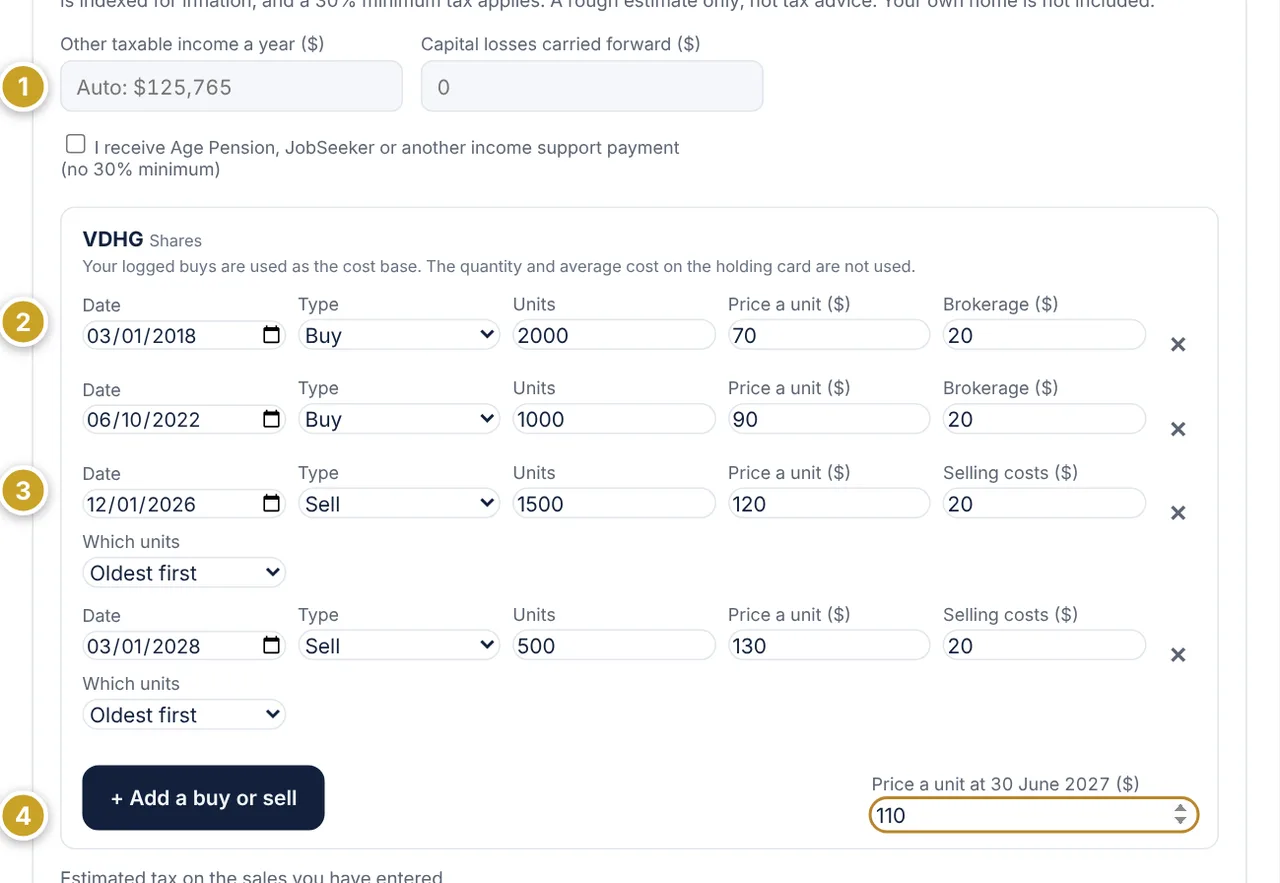
- Other taxable income and losses brought forward
- Buys, each kept as a parcel
- Sales, with the choice of which units are sold
- Price at 30 June 2027 (optional)
What the rules are
Sales before 1 July 2027 use the 50% discount on gains for assets held 12 months or more. From 1 July 2027 the discount is replaced by cost base indexation (your cost is lifted by inflation) and a 30% minimum tax on gains. The law is passed, but gains that built up before 1 July 2027 keep the 50% discount: every asset is treated as bought again at its market value on 30 June 2027, and the gain is split there. Super funds and companies are not affected, and the 30% minimum does not apply if you receive income support.
You can choose, when you sell, between the market value on 30 June 2027 and an apportionment of the gain by the time held. The market value uses the price you type in the 30 June 2027 box, or an estimate from today's price and your growth rate until then. The apportionment method has not been published yet, so Track My Wealth uses a straight-line split by days held, labels it provisional, and shows whichever of the two gives the lower tax.
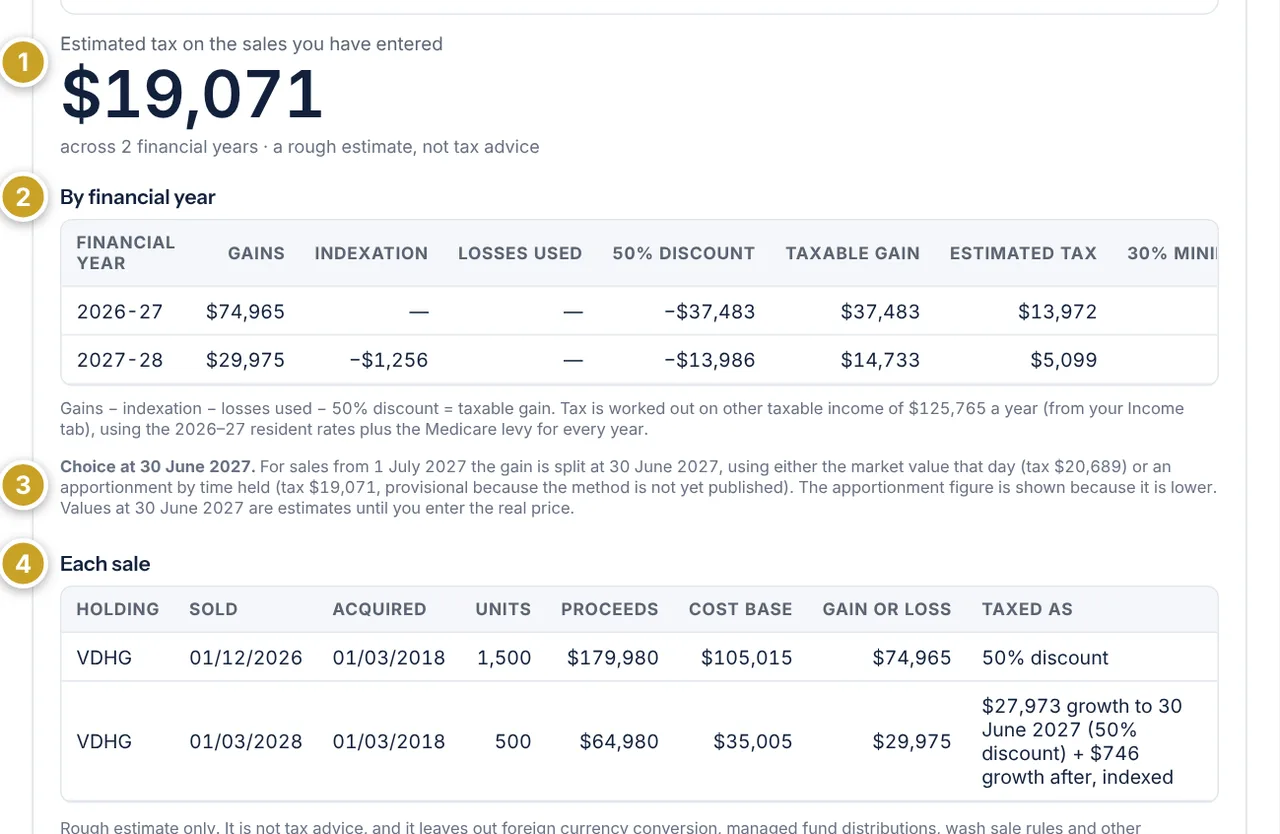
- Estimated tax on the sales entered
- By financial year: gains, indexation, losses, 50% discount and taxable gain
- The 30 June 2027 choice
- Each sale and how it is taxed
Losses, reports and negative gearing
Losses from sales are used against gains in the same year and carried forward (type any you already have under Capital losses carried forward). The full Export Report adds a Capital gains page for each profile that has sales. On a property card, the Contract date and Newly built home fields also drive the negative gearing change: from 1 July 2027, losses on established homes bought after 12 May 2026 can only be set against rent or property gains, so the Cash Flow tab shows a second negative gearing figure for those properties. New builds and properties held on that date are not affected.
This is a rough estimate, not tax advice. It leaves out foreign currency conversion, managed fund distributions, wash sale rules and other adjustments, and the way gains are split at 30 June 2027 and the exact indexation formula are not yet final. Combined view does not show this tab, because tax depends on each person's own income: choose a profile.
Cash Flow
Rental and dividend income across your portfolio, plus salary/consulting income from the Income tab, minus loan repayments and holding costs — this is where the "Net income" figure comes from. Includes a 5-year projected available income chart and a per-property and per-holding breakdown. If you've set up the Retirement planner, a Retirement cash flow chart appears here too.
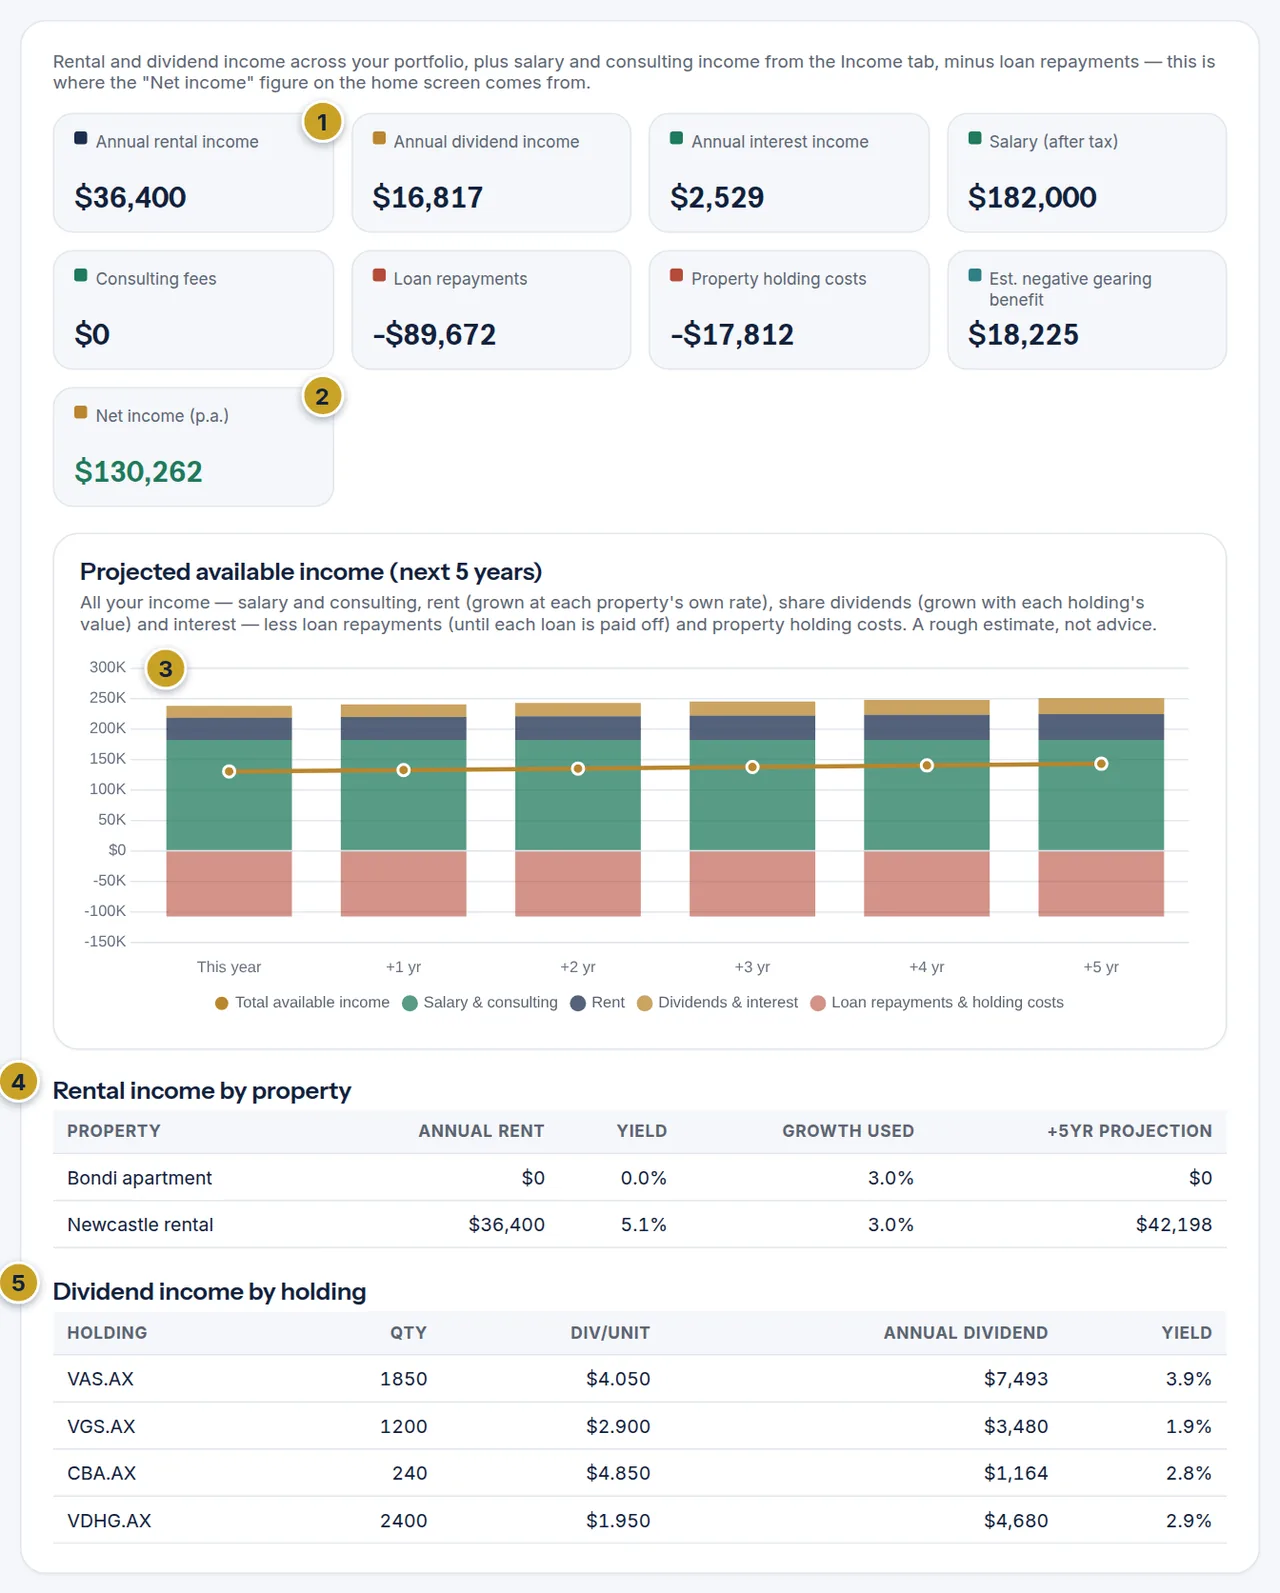
- Annual rental income tile
- Net income (p.a.)
- Projected available income chart
- Rental income by property
- Dividend income by holding
Income
Add any income that isn't already covered by rent or dividends — salary, a partner's income, consulting fees. Enter the annual after-tax amount (your take-home pay); it adds into "Net income" but doesn't automatically top up a cash balance — do that yourself on the Cash tab if you want savings reflected in your total wealth. Pay before tax is worked out for you from that amount using the 2026–27 ATO resident rates plus the Medicare levy (type a figure if yours differs), and the super contribution rate (12% for a salary unless you change it) is applied to it to fill in your super contributions for the Retirement planner. If you'd rather start from your pay before tax, leave the after-tax box blank and type it there. Choose Stops when I retire (or a last year) under "This income" and the Cash Flow tab drops it from your retirement years.
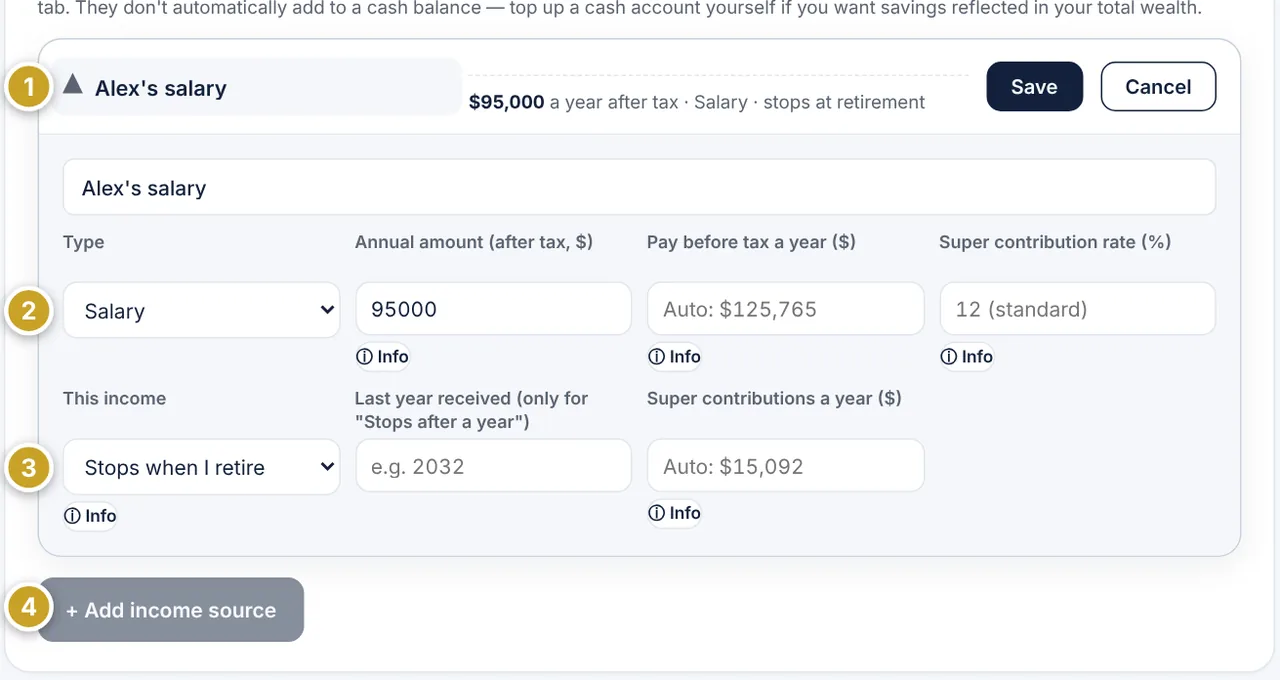
- Income source name
- Type, after-tax amount, pay before tax (worked out for you) and super rate
- When the income stops, and super contributions a year
- + Add income source
Goals
Set a target net wealth and a year to reach it by. A progress bar measures it against the Future Wealth Projection for that year, uncapped (not limited to the 10-year dropdown on the Overview), and tells you whether you're on track.
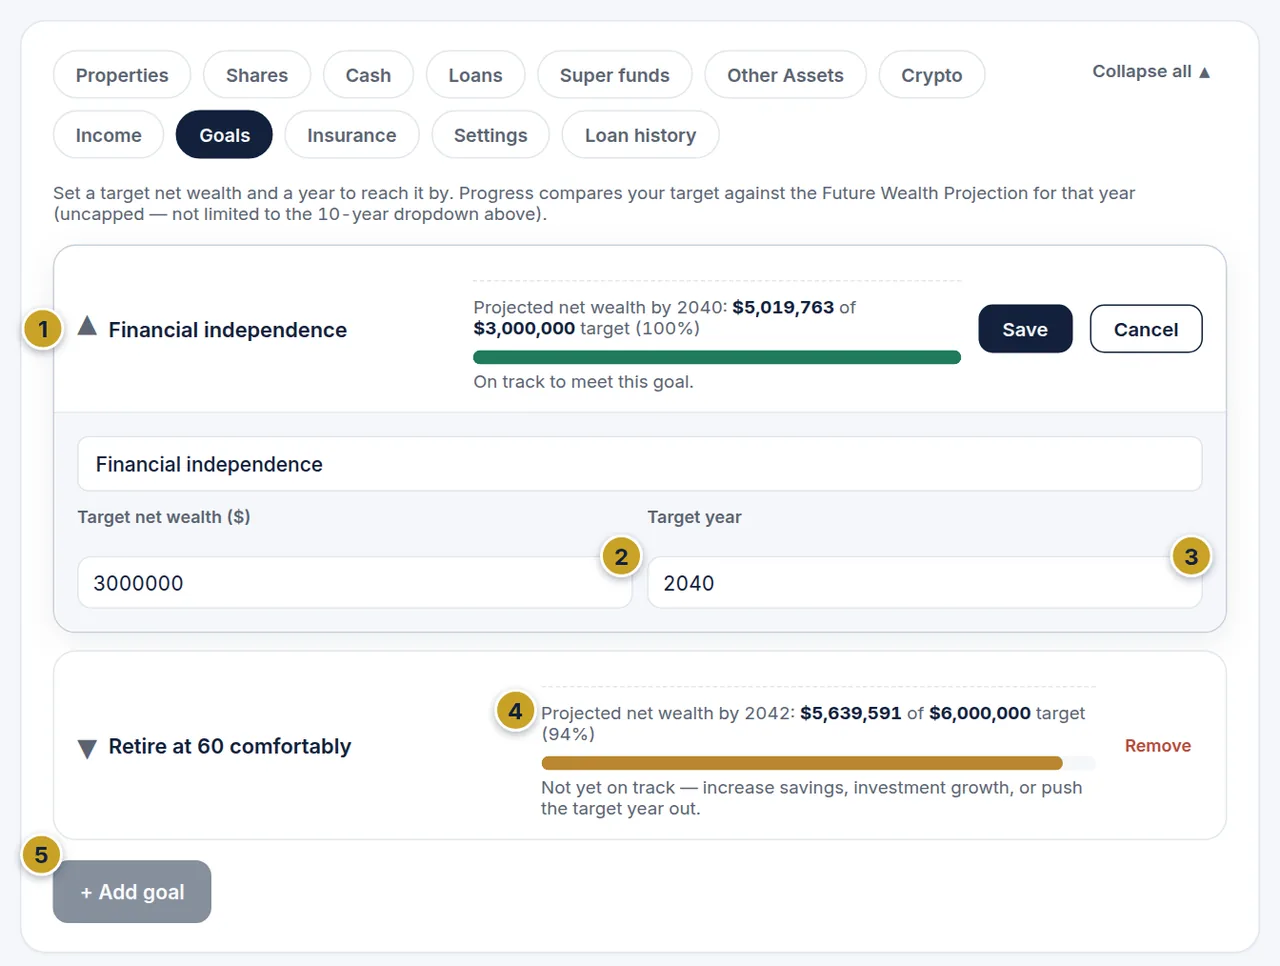
- Goal name
- Target net wealth
- Target year
- Progress against the projection
- + Add goal
Insurance
A record of your life, TPD, income protection and trauma cover, with a summary of total cover by type. This is a coverage summary, not advice on how much cover you need — talk to a financial adviser for that assessment.
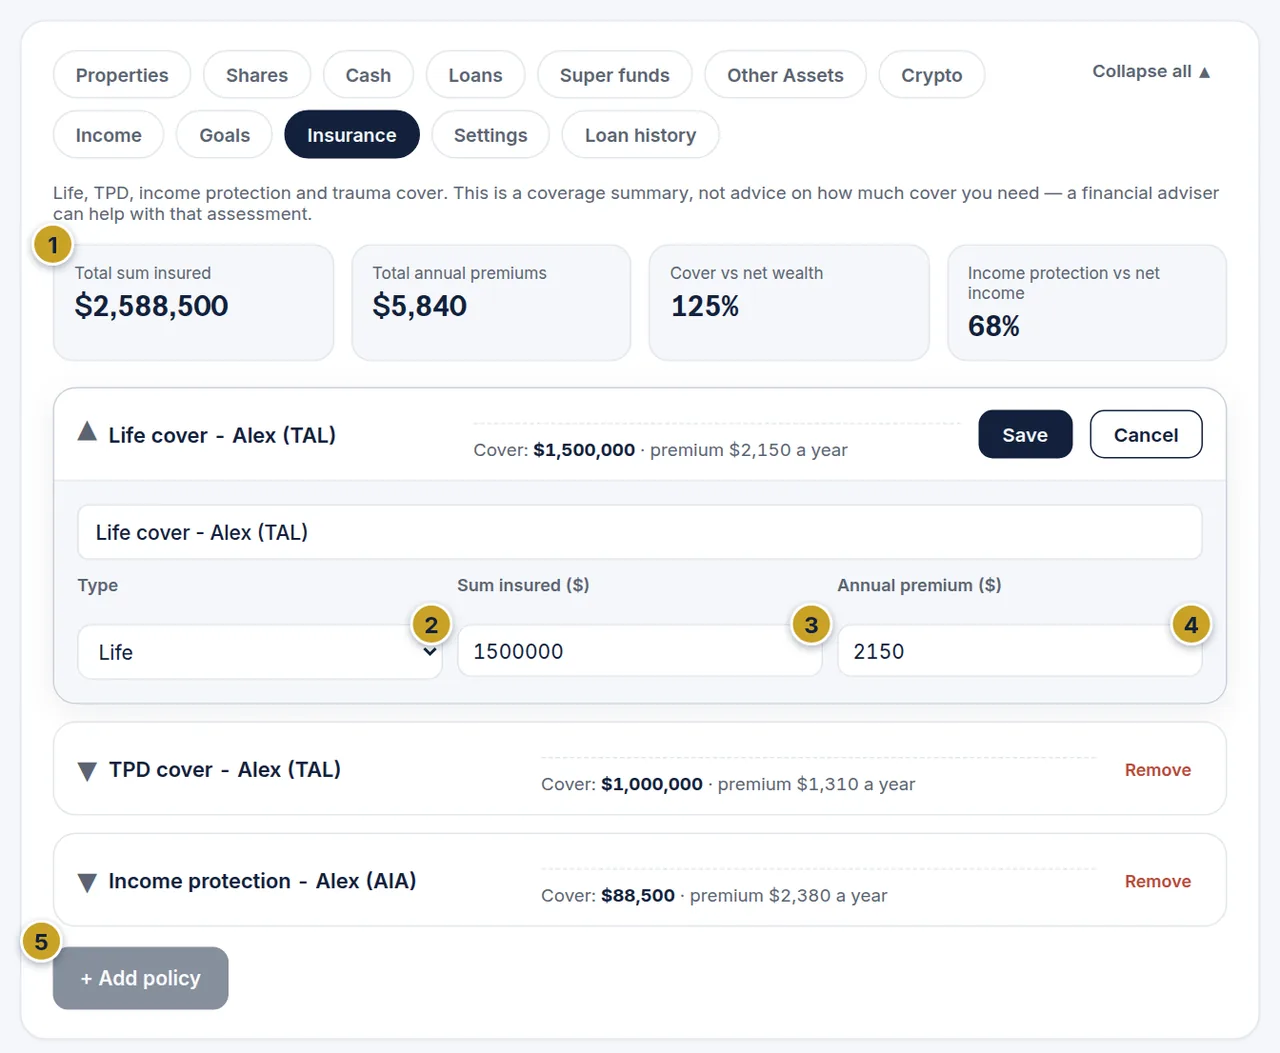
- Cover summary tiles
- Type
- Sum insured
- Annual premium
- + Add policy
Notes
A timestamped log of what's changed and why — you or anyone with edit access to the file can add a note at any time, by typing, dictating, or recording and cleaning it up with an AI summary. Each note shows who wrote it and when, and is marked Typed, Voice or AI summary. Notes can't be edited after saving (only removed), so the timeline stays a trustworthy record of what happened and when.
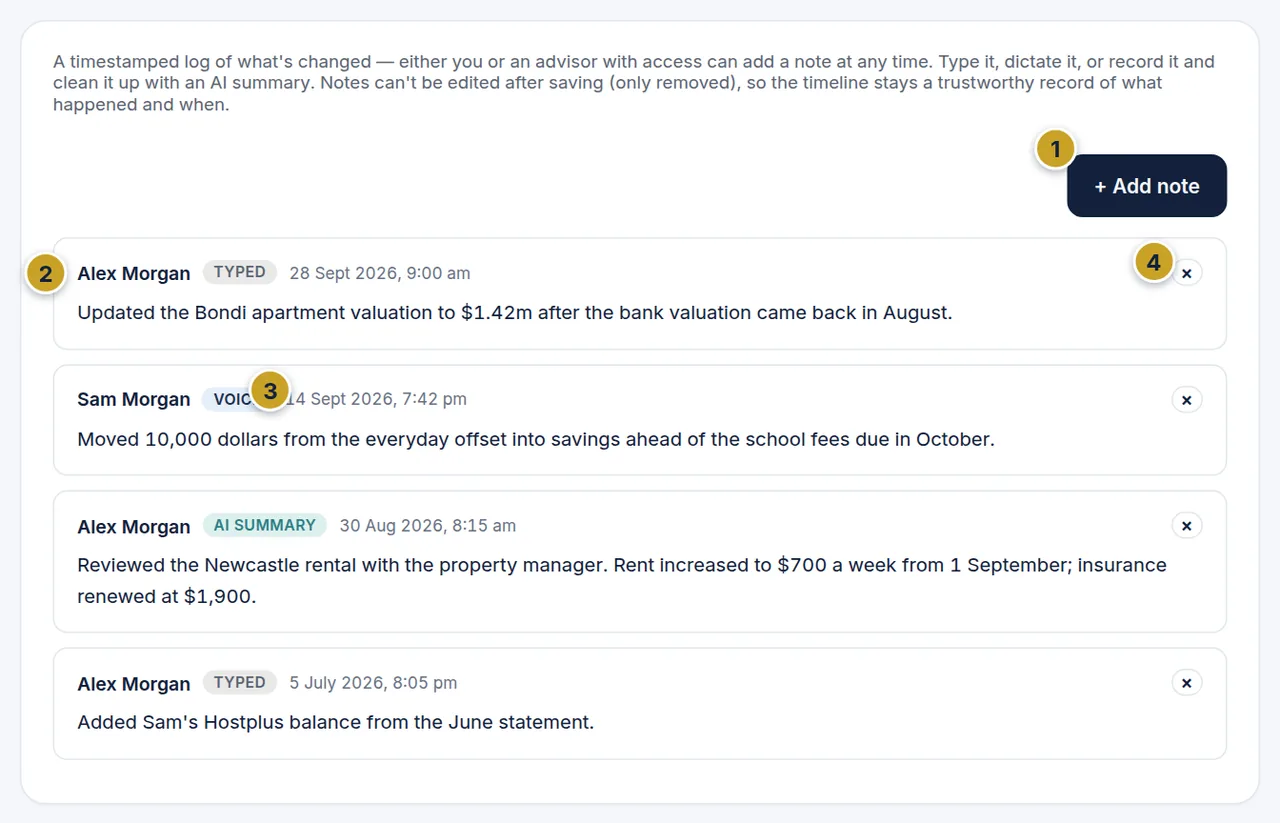
- Add note
- Author and timestamp
- Typed / Voice / AI summary badge
- Delete note
Settings
Open the Settings tab in Holdings for this file's own options: default growth rates for property, rental income, shares and crypto (used whenever a holding doesn't have its own override), your marginal tax rate (for the rough CGT/negative-gearing estimates), toggles for which categories count toward total wealth, who has access to the file, a weekly "portfolio value today" email if you want one, and a legacy statement contact — someone we'd send a read-only snapshot to if you stopped responding to our check-ins.
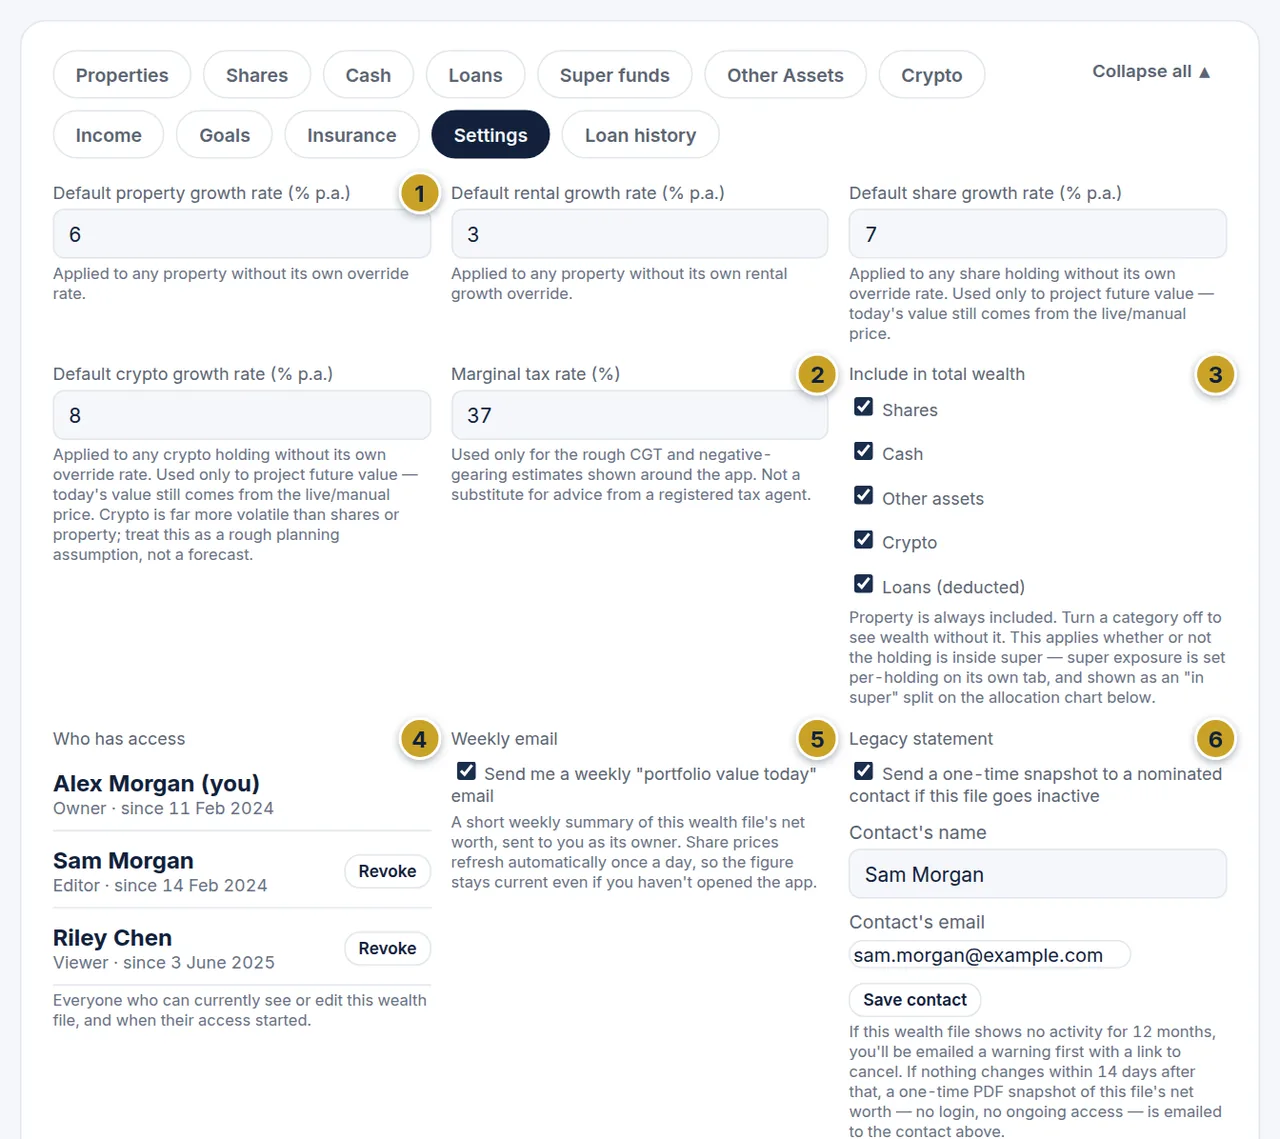
- Default growth rates
- Marginal tax rate
- Include in total wealth toggles
- Who has access
- Weekly email
- Legacy statement contact
Future wealth, FIRE & the Tools panel
Future wealth projection
Estimates your net wealth in a chosen future year — property and shares grown at their own rate, loans paid down, cash held flat. Advanced unlocks stress-test controls (a property or share market shock, an interest-rate change) applied on top, without changing your saved data.
FIRE countdown & net worth benchmark
Two collapsible cards on the Overview: set a target net wealth to see roughly when you'll reach it, and compare your net wealth to the Australian average for your age bracket (ABS household wealth data).
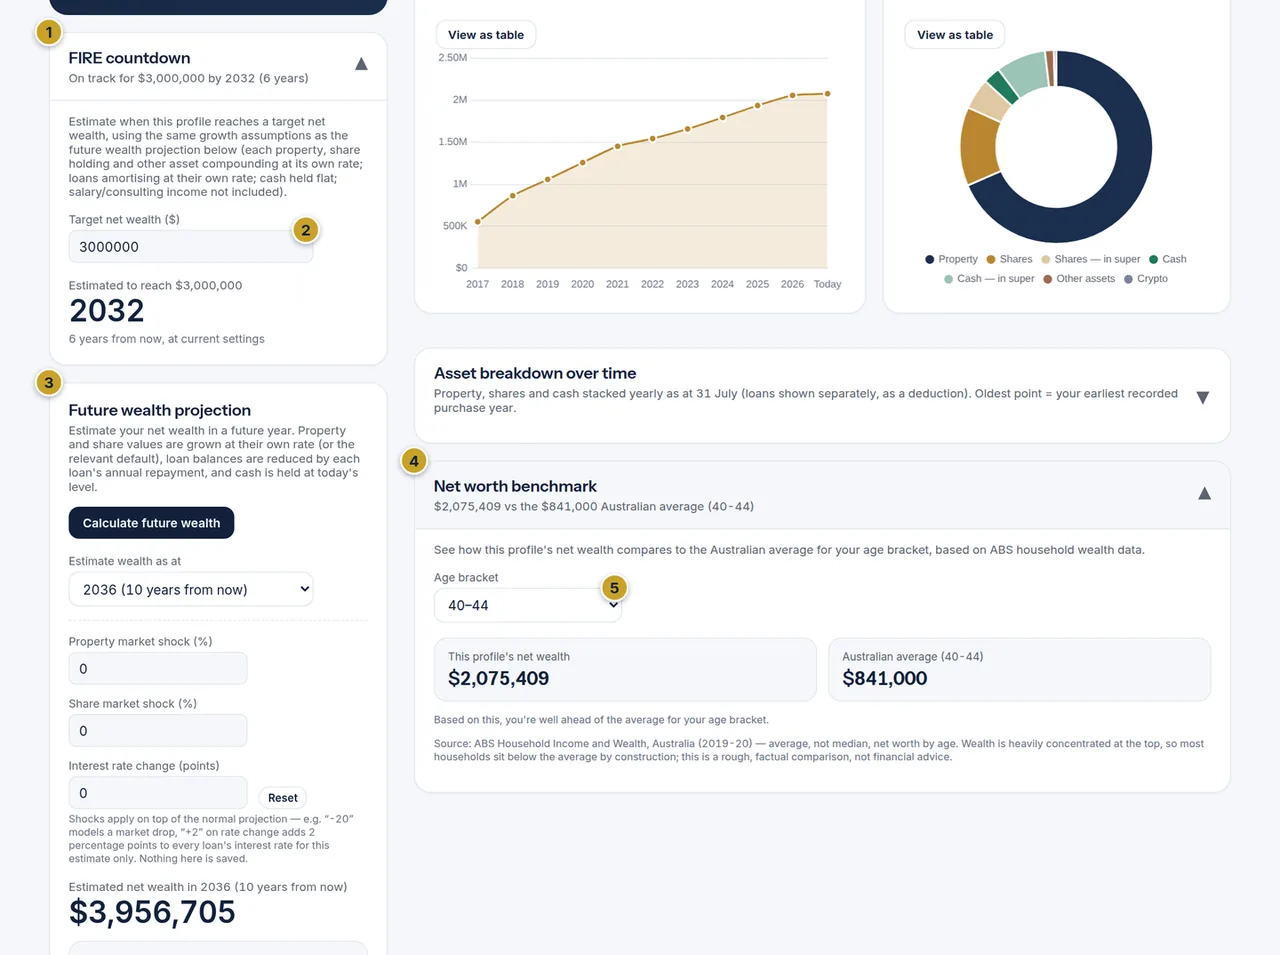
- FIRE countdown
- Target net wealth
- Future wealth projection
- Net worth benchmark
- Age bracket
Tools panel
Open the Tools menu in the top bar and choose a calculator, such as a loan repayment or duty/tax calculator. The panel floats over the page, and some tools can pre-fill from a loan you already track. It's separate from your saved wealth-file data and remembered per-device only.
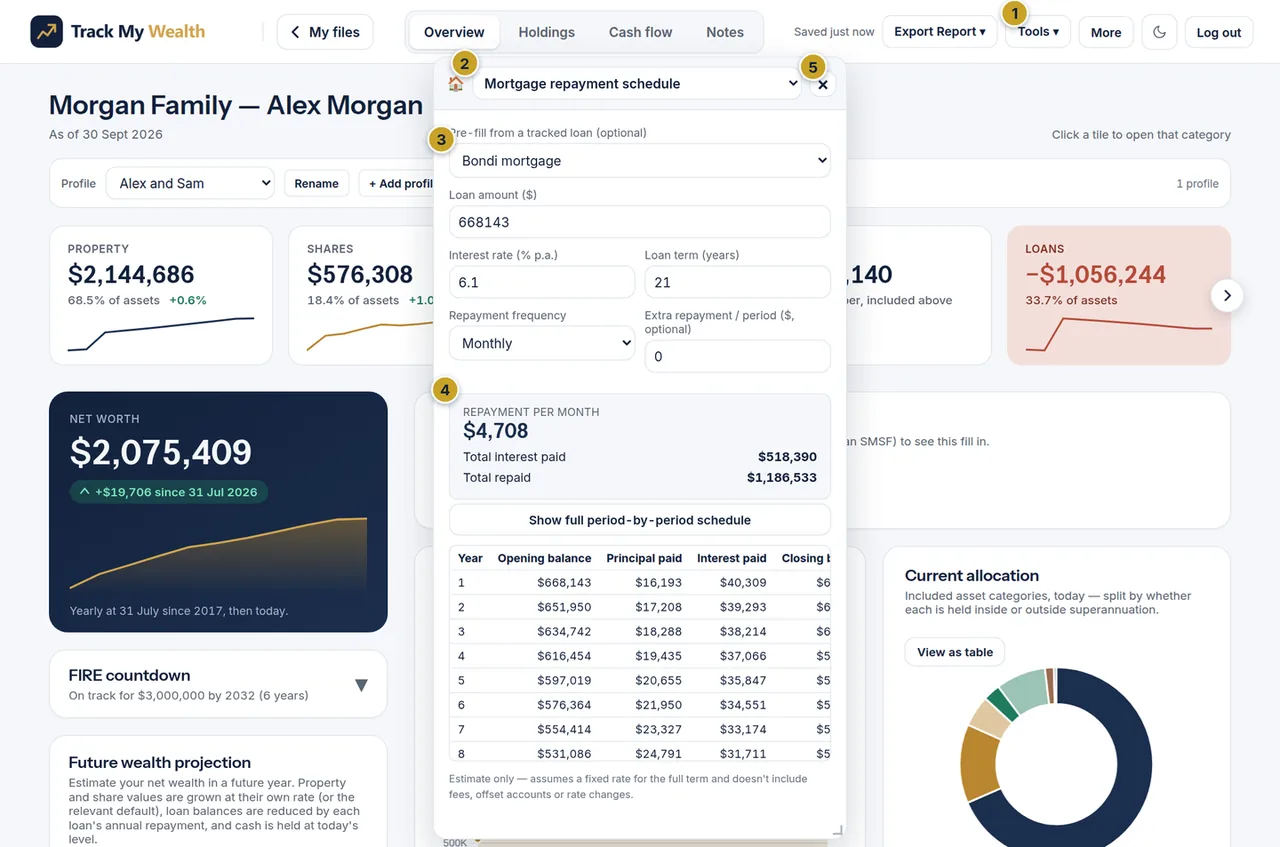
- Tools menu
- Tool selector
- Pre-fill from a tracked loan
- Result
- Close
Exporting a report
Advanced Export Report (top bar) offers a Full report — a multi-page PDF summary of this wealth file — and a Lender statement, a tidier view for a bank or broker. The third item, Copy summary for AI, copies a plain-text summary to paste into Claude or ChatGPT (see Using Claude or ChatGPT). If you have more than one profile, the full report includes a combined household summary page automatically. When the Retirement planner has an age and retirement age, the full report also ends with a Retirement planner page. Each profile with logged sales also gets a Capital gains page.

- Export Report
- Full report
- Lender statement
- Copy summary for AI
Using Claude or ChatGPT with your wealth files
Advanced You can let an AI assistant such as Claude or ChatGPT read your figures, so you can ask questions in plain English, for example "Summarise my cash flow" or "What happens to my net worth if property values fall 10%?". There are two ways to do it:
- Copy a summary: nothing to set up. You copy a snapshot of your wealth file and paste it into a chat. It is a one-off picture, so copy again whenever your figures change.
- Connect the assistant: a live, read-only link. You set it up once, approve it on a Track My Wealth sign-in page, and from then on the assistant looks up your figures itself whenever you ask.
Either way the assistant sees everything except your Notes. It never sees your legacy contact, who a file is shared with, email addresses, passwords or billing details, and it cannot change anything in your wealth files. Answers are general information based on your own rough estimates, not financial, tax or legal advice.
Option 1: Copy a summary
- Open the wealth file and choose Export Report then Copy summary for AI (the last item in the menu, see Exporting a report).
- A message at the top confirms the summary has been copied. With the Combined view selected it covers every profile; otherwise it covers the profile you are looking at.
- Open a chat in Claude or ChatGPT, paste (Ctrl+V), then type your question underneath.
On the phone app, tap ⋯ on a wealth file then Share summary with an AI, and choose Copy or send it straight to the Claude or ChatGPT app. See the App Help Guide.
Option 2: Connect Claude or ChatGPT
Before you start, you need:
- An Advanced plan (the 14-day free trial counts).
- A Claude or ChatGPT plan that lets you add a custom connector. These are available on some plans only, and the names of the menus change from time to time, so check the assistant's own help if you can't find the option.
- This connector address, which you will paste into the assistant:
https://trackmywealth.au/mcp
Setting it up in Claude
- In Claude, open Settings then Connectors, and choose Add custom connector.
- Name it Track My Wealth, paste the address above and choose Add.
- Choose Connect. A Track My Wealth page opens in your browser.
- Sign in to Track My Wealth if asked (with your two-factor code if you use one), then follow Approving the connection below.
- You return to Claude, and the connector now shows as connected. Start a new chat and ask a question.
Setting it up in ChatGPT
- In ChatGPT, open Settings then Apps (also called Connectors). If you can't add your own, look under Advanced settings and switch on Developer mode.
- Choose to create a new app or connector. Name it Track My Wealth, paste the address above as the MCP server address, and choose OAuth as the sign-in method.
- Create it, then choose Connect. A Track My Wealth page opens.
- Sign in and approve as described below.
- In a new chat, pick Track My Wealth from the tools menu (the + button) so ChatGPT can use it.
Approving the connection
The page that opens is ours, not the assistant's: the assistant never sees your Track My Wealth password. It names the assistant asking, and you choose exactly which wealth files it may read. All your files are ticked to start with, so untick any you want to keep private. Files that were shared with you are listed too. Choose Allow read-only access, or Cancel to refuse. If your account isn't on the Advanced plan, the page tells you so instead.
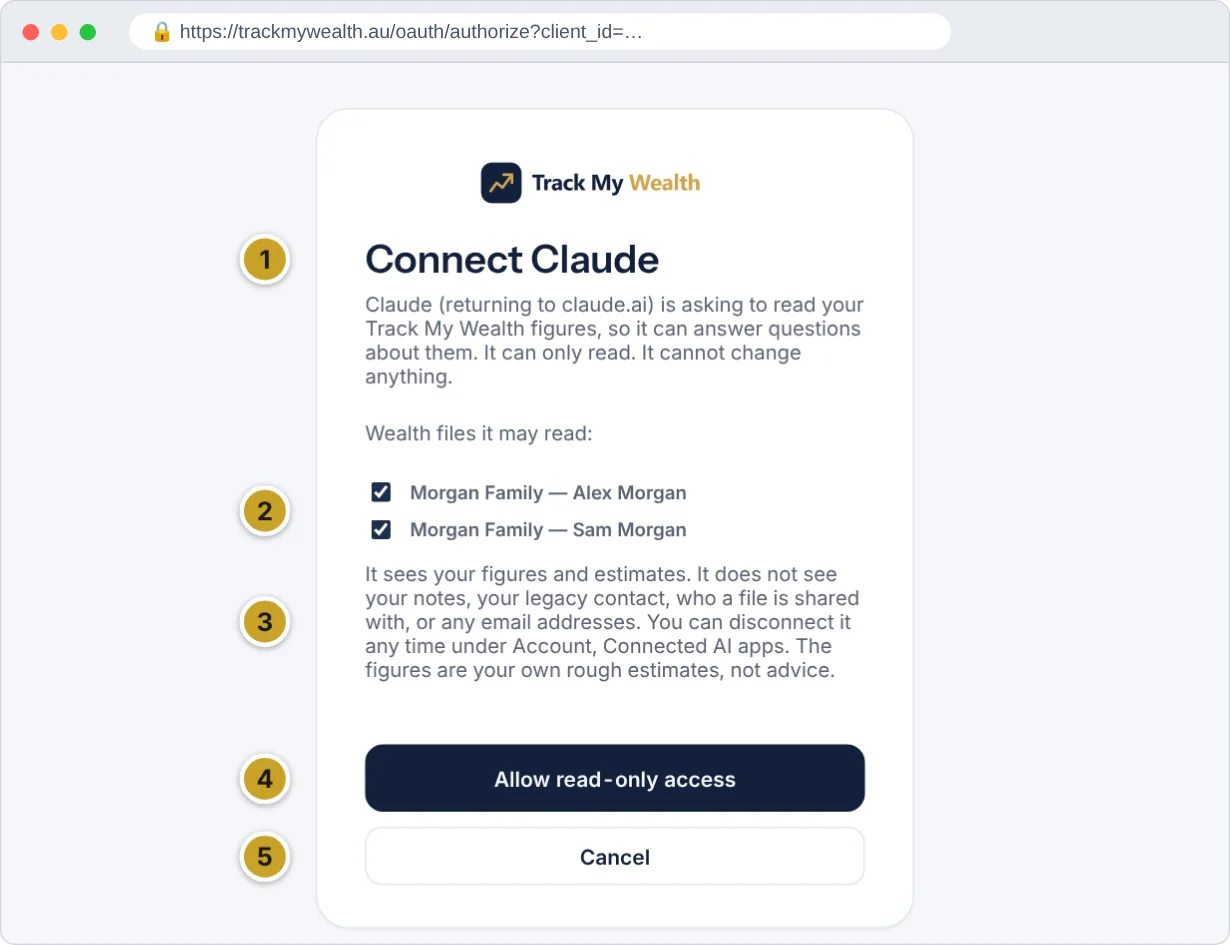
- The assistant asking for access
- Wealth files it may read (untick any to keep them out)
- What it can and cannot see
- Allow read-only access
- Cancel
What to expect once it's connected
- Ask as normal. When a question needs your figures, the assistant tells you it is using Track My Wealth, and may ask your permission the first time. It then reads the wealth files you ticked. Try "What is my net worth, and how is it split?", "Which loans cost me the most interest?", "How long might my super last?" or "Which of my holdings has the biggest capital gain?".
- It sees your figures as they are saved. That means net worth and totals, properties, shares, cash, loans, other assets, super, income, goals, insurance, cash flow, the Retirement planner results and capital gains estimates. Your changes save automatically, and the assistant sees them the next time it asks.
- It can only read. It can't add, edit or delete anything, and it can't see your Notes, your legacy contact, who a file is shared with, or email addresses.
- Several profiles. It can read each profile in a file and the household total. Joint holdings entered twice are counted twice, so ask it to check for double counting.
- Check what it tells you. Assistants can misread a figure or make arithmetic mistakes, and the figures are only as good as what you have entered. Treat answers as a starting point, and speak to a licensed financial adviser or a registered tax agent before acting on them.
Seeing and ending connections
Go to Account and find Connected AI apps. Each connection shows the assistant, the wealth files it can read, when you connected it and when it last looked. Choose Disconnect and it stops straight away. To change which files an assistant can read, disconnect it and connect again.
A connection also ends when you reset a forgotten password or delete your account. If your plan drops back to Starter the connection stays listed, but the assistant is refused until you are on Advanced again.
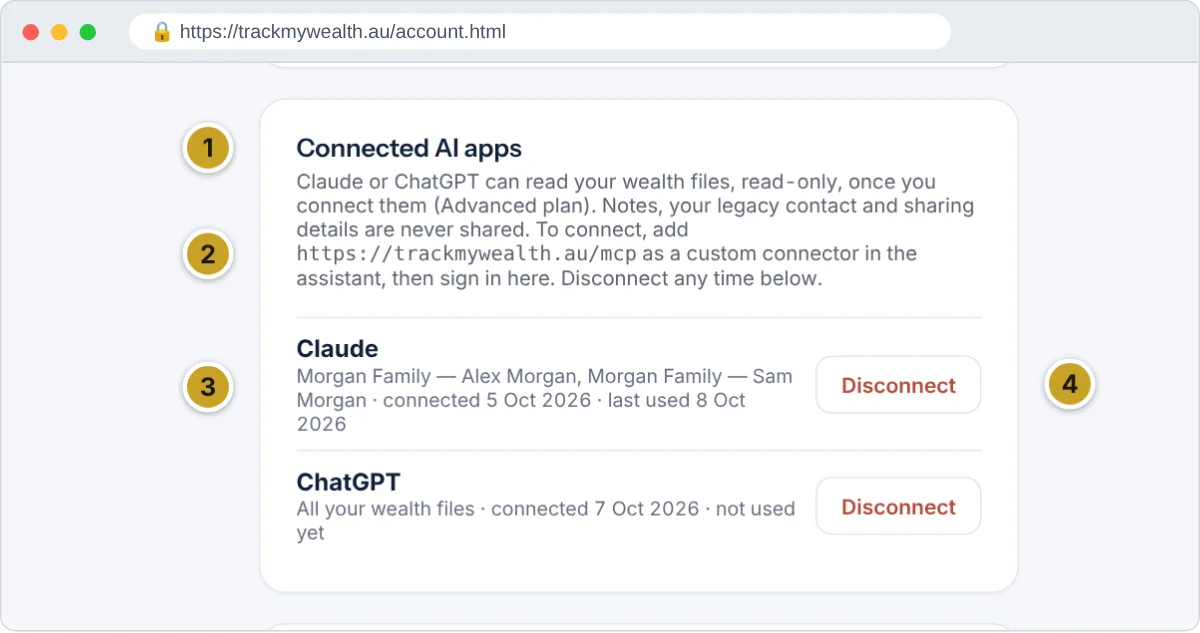
- Connected AI apps card
- The connector address to add in the assistant
- An assistant, the files it can read and when it was last used
- Disconnect
Your information and the AI provider
Track My Wealth only sends figures to an assistant when you connect it or paste a summary yourself. Once the assistant has your figures, they are part of your conversation with Claude (Anthropic) or ChatGPT (OpenAI) and are handled under that company's terms and privacy settings, including how long chats are kept and whether they can be used to improve their models. We don't control that, so check their settings and share only what you are comfortable with. See our Privacy Policy.
If something goes wrong
- The assistant says you need the Advanced plan. Check your plan under Plans & billing.
- It can't find a wealth file. The file may not have been ticked. Disconnect and connect again, ticking it this time.
- Connecting fails or loops. Check the address is exactly as shown, ending in
/mcp, with no spaces. Make sure you are signed in to Track My Wealth in the same browser, then try again. - It stopped working after some time. You may have reset a forgotten password, disconnected it, or your plan may have ended. Connect again.
Still stuck? Contact us.
Sharing & multiple profiles
From My wealth files, click Share on a wealth file. You'll see everyone who has access and their role, and you can invite someone by email as an Editor (can add/change everything) or a Viewer (read-only — you'll see a banner reminding you when you're the one viewing someone else's file this way). Change a role, or remove someone's access, from the same dialog. An invitation shows as Pending until it's accepted. A Manager can also manage who has access; Managers are set up through the Client Manager plan (see Managing clients).
This is different from the profile switcher described in Getting started, which combines two people's own holdings into one household view within a single login.
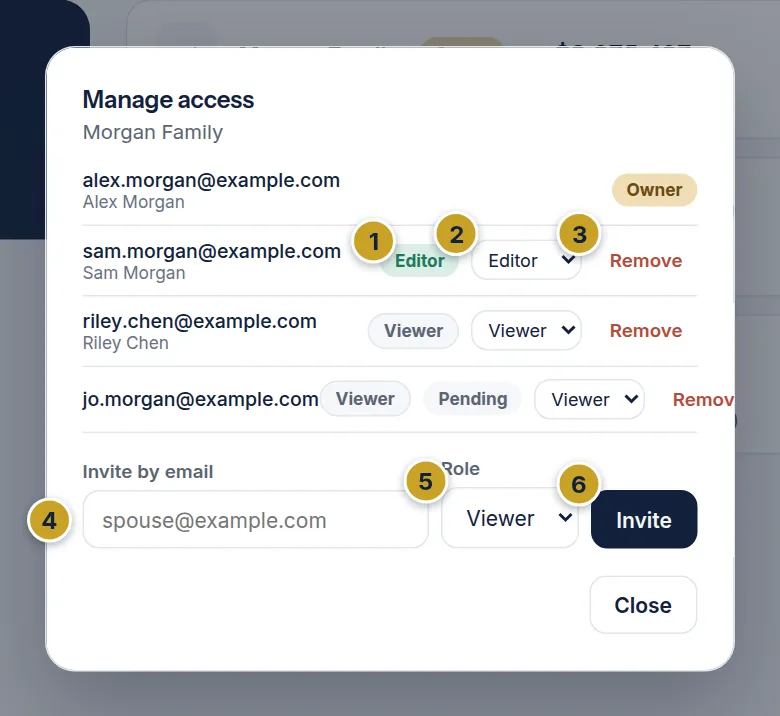
- People with access and their role
- Change role (Editor or Viewer)
- Remove access
- Invite by email
- Role for the invitation
- Invite button
Account & security
Open Account from the top bar. From here you can:
- Change your name. Fix a typo from sign-up in the Your name card and press Save name. Your email address stays the same, and the new name shows at the top of every page.
- Set your Country. Choose your country and press Save country. It sets your display currency and which tax tools you see: Australia shows the full set of Australian tax tools (land tax, negative gearing, stamp duty, CGT, retirement drawdown), and other countries hide them. You choose it when you sign up and can change it here at any time.
- Change your password. Enter your current password, then your new one twice (at least 8 characters), and enter your 6-digit two-factor code if you use one. You stay signed in on this device and are signed out everywhere else. Tick Show passwords to check what you've typed.
- Turn on two-factor authentication — a second step at login, using an authenticator app (Google Authenticator, Authy, 1Password and similar). Strongly recommended.
- Choose what you see (Display preferences). Switch off dashboard features you don't use (FIRE countdown, net worth benchmark, future wealth projection, asset breakdown), and choose which data tabs show in your wealth files and in what order — tick to show, drag a row to reorder, then press Save preferences. Hiding a tab never deletes anything you've entered, and it applies to every wealth file you own.
- See and disconnect AI apps. The Connected AI apps card lists any assistant (Claude or ChatGPT) you have linked to your wealth files, with a Disconnect button. See Using Claude or ChatGPT.
- Contact us — send a message to our team; we'll reply to the email on your account.
- Delete my account — see Deleting your account.
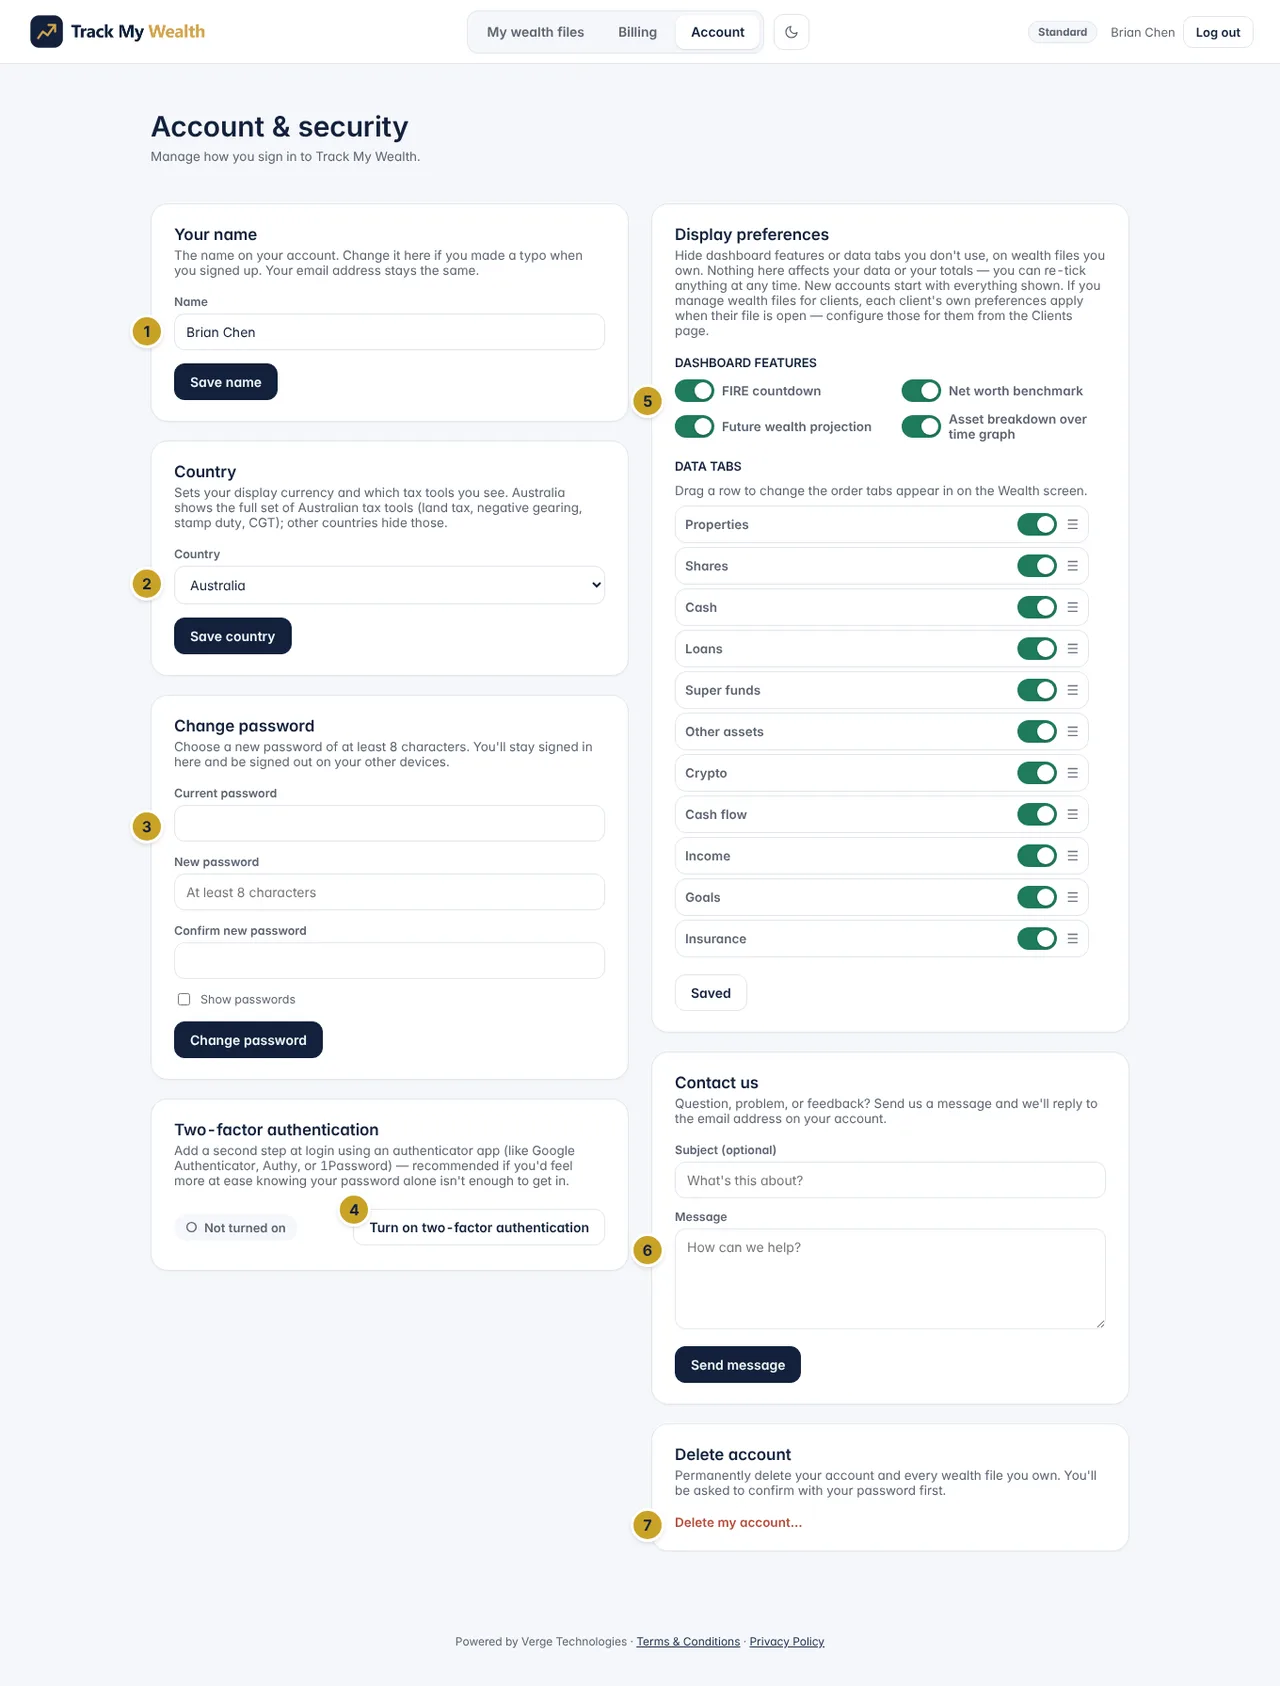
- Your name
- Country (sets which tax tools you see)
- Change your password
- Turn on two-factor authentication
- Dashboard feature toggles (data tabs sit below: tick to show, drag to reorder, then Save preferences)
- Contact us
- Delete my account
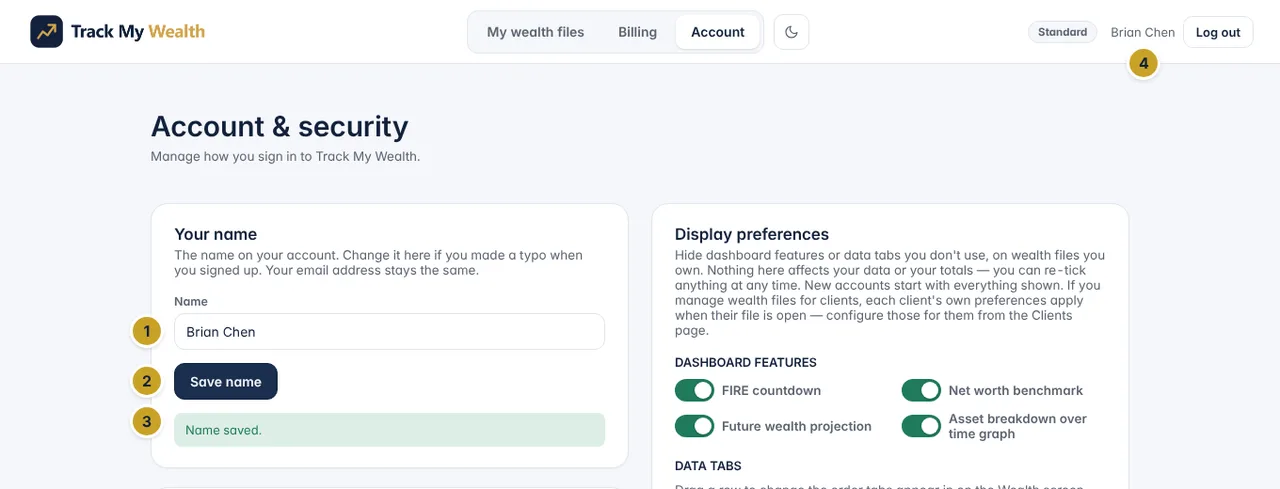
- Name box
- Save name
- Confirmation
- Your name in the header
Plans & billing
The Billing page shows your current plan. Starter is free. Advanced adds the Australian tax and scenario tools, PDF reports and AI voice notes; Client Manager adds everything in Advanced plus client management. Both paid plans include a 14-day free trial — a card is required to start, but you aren't charged until the trial ends, and you can cancel any time before then. Switch between Monthly and Annual (two months free) at the top of the plan cards.
If you subscribed in the mobile app through the App Store or Google Play, manage or cancel that subscription with Apple or Google instead — the Billing page shows it as a store plan and doesn't offer Manage billing for it.
Complimentary access. Sometimes we grant a set period of Advanced or Client Manager access at no charge. The Billing page then reads “Complimentary access” and there is nothing to pay. We email you 7 days before it ends and again when it has ended; if you don't subscribe, your account returns to Starter and your wealth files are kept (Advanced-only tools are switched off). A complimentary Client Manager plan includes 5 free clients. To keep your plan, start a trial or subscribe on the Billing page before it ends.
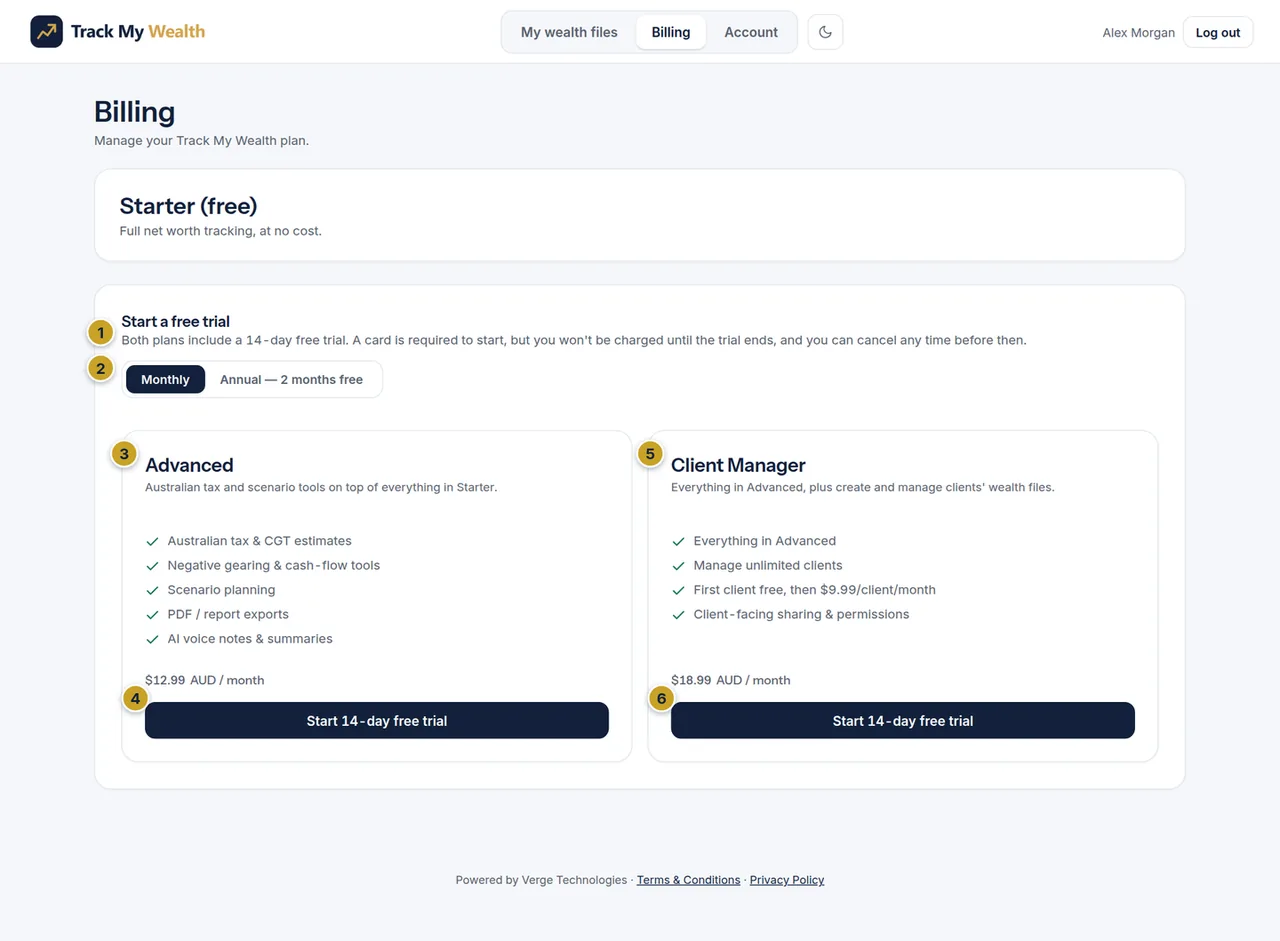
- 14-day free trial wording
- Monthly or Annual toggle
- Advanced plan
- Start Advanced trial
- Client Manager plan
- Start Client Manager trial
Managing clients
On the Client Manager plan, your Dashboard shows your clients, their wealth files and your client fees. Use + Add Wealth File for a file of your own, Invite existing client to link someone who already has an account, or + Add client to create a client's login and first wealth file in one step. Each client tile lets you Open, Rename, Share or open Configuration. A client who hasn't confirmed their email yet is marked Unverified. Your first client is free; further clients are billed monthly, and you can see the count and renewal date on the Dashboard.
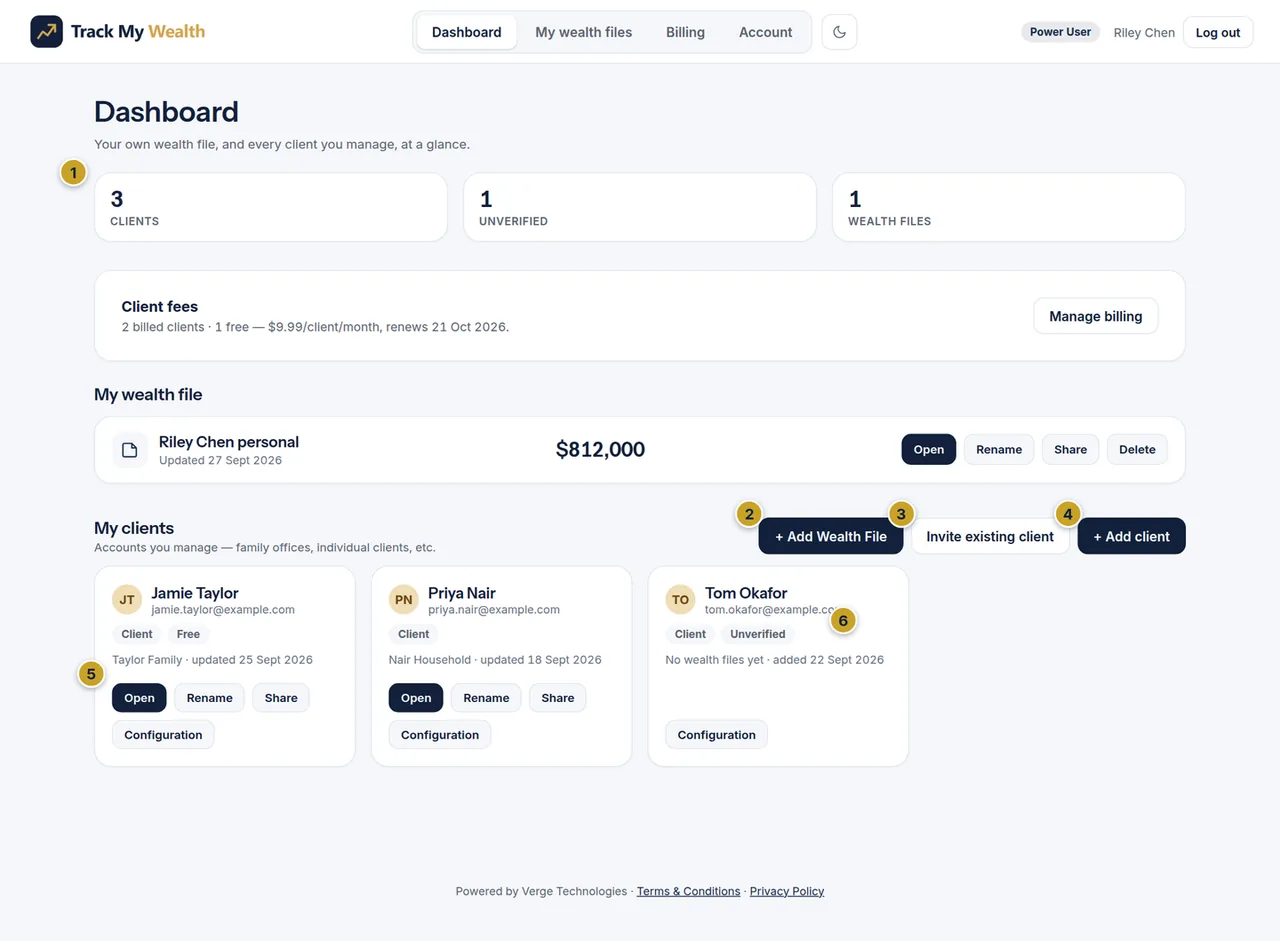
- Client and file counts
- Add Wealth File for a client
- Invite an existing client
- Add client (create their login)
- A client tile: Open, Rename, Share, Configuration
- Unverified client with no file yet
Deleting your account
Go to Account and choose Delete my account. The page lists what will be deleted, including every wealth file you own. To confirm, enter your password, your two-factor code if you use one, and type DELETE.
- If you pay by card, your subscription is cancelled immediately, with no refund for the rest of the current period.
- If you subscribed through the App Store or Google Play, cancel that subscription with Apple or Google first — deleting your account doesn't cancel it.
- We keep a recoverable copy for 30 days. If you change your mind, email info@vergetec.au within that time and we can restore it. After that, it's permanently erased.
- Shared files: people you've shared a wealth file with lose access when the file is deleted.
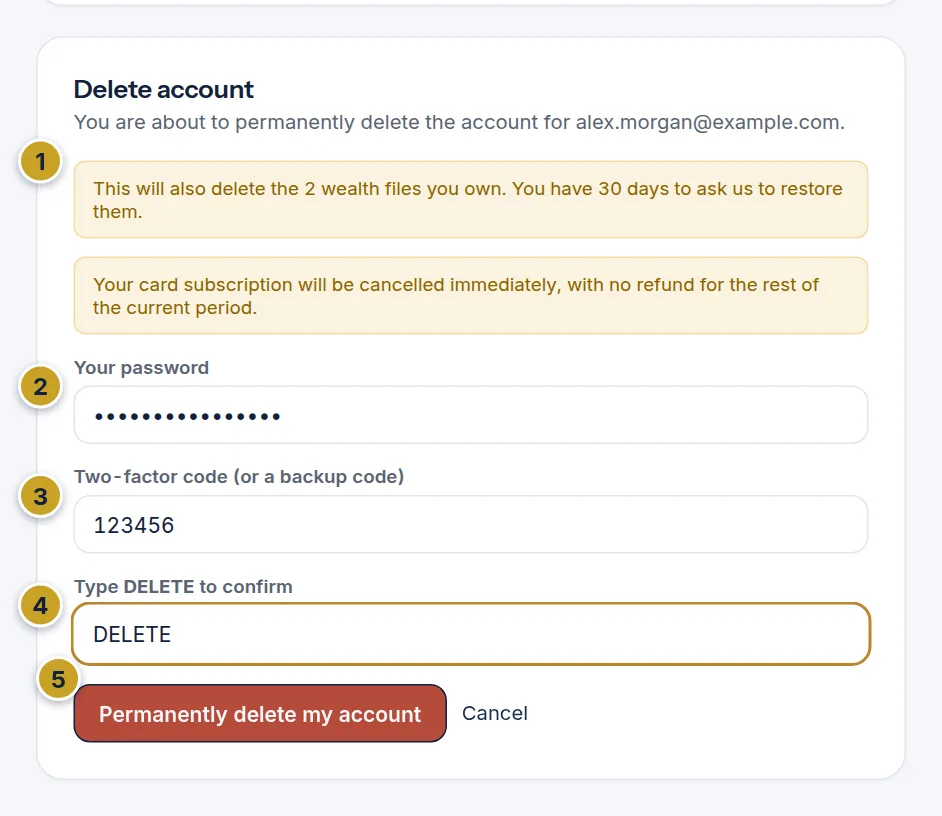
- What will be deleted
- Your password
- Two-factor code (only if two-factor is on)
- Type DELETE
- Permanently delete my account
Advanced features
A few features throughout the app are marked Advanced — Australian CGT and negative-gearing estimates, the Capital gains tab, the Retirement planner, franking credit figures, land tax estimates, future-wealth stress-testing, the full PDF Export Report, and linking Claude or ChatGPT to your wealth files. These are part of a paid tier with a 14-day free trial; everything else in this guide is available on every account. Check your Billing page for current plan details.
None of the tax or planning figures anywhere in Track My Wealth are financial, tax or legal advice — they're rough, general estimates for your own reference. See the Terms & Conditions for the full disclaimer.
Using the mobile app? It has its own App Help Guide, since some screens and workflows differ.